Food Lion 2003 Annual Report Download - page 65
Download and view the complete annual report
Please find page 65 of the 2003 Food Lion annual report below. You can navigate through the pages in the report by either clicking on the pages listed below, or by using the keyword search tool below to find specific information within the annual report.-
 1
1 -
2
-
3
-
4
-
5
-
6
-
7
-
8
-
9
-
10
-
11
-
12
-
13
-
14
-
15
-
16
-
17
-
18
-
19
-
20
-
21
-
22
-
23
-
24
-
25
-
26
-
27
-
28
-
29
-
30
-
31
-
32
-
33
-
34
-
35
-
36
-
37
-
38
-
39
-
40
-
41
-
42
-
43
-
44
-
45
-
46
-
47
-
48
-
49
-
50
-
51
-
52
-
53
-
54
-
 55
55 -
 56
56 -
 57
57 -
 58
58 -
 59
59 -
 60
60 -
 61
61 -
 62
62 -
 63
63 -
 64
64 -
 65
65 -
 66
66 -
 67
67 -
 68
68 -
 69
69 -
 70
70 -
 71
71 -
 72
72 -
 73
73 -
 74
74 -
 75
75 -
76
-
77
-
78
-
79
-
80
 |
 |
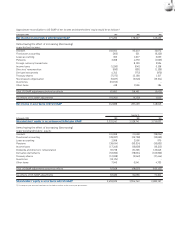
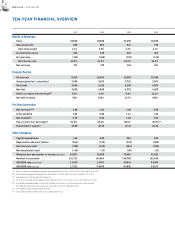
63
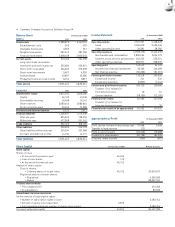
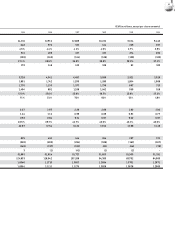
(EUR in millions, except per share amounts)
1999 1998 1997 1996 1995 1994
14,310 12,912 12,608 10,222 9,134 9,440
648 573 511 414 339 357
4.5%4.4% 4.1% 4.0% 3.7%3.8%
511 455 337 331 274 282
(190)(162) (124) (129) (105)(105)
37.1%35.6% 36.8% 38.8%38.3%37.2%
170 149 122 108 93 100
5,728 4,541 4,487 3,989 2,921 2,928
1,991 1,742 1,570 1,286 1,084 1,088
1,770 1,135 1,377 1,276 687 713
1,404 881 1,158 1,042 550 518
17.0%17.0% 15.9% 16.7% 15.8%17.2%
71%51% 75% 82% 51%48%
3.27 2.87 2.36 2.09 1.82 1.94
1.24 1.12 0.99 0.89 0.83 0.77
0.93 0.84 0.74 0.67 0.62 0.57
38.5%39.7% 42.7% 43.6%46.3% 40.6%
20.87 17.54 16.23 13.52 11.58 11.40
525 451 444 354 257 173
(328)(295) (294) (188) (163)(167)
(140)(117) (133) (82) (64)(75)
3(1) (41) (1) (2)-
51,983 51,824 51,717 51,603 51,303 51,291
124,933 118,942 107,208 94,360 89,702 84,060
1.0046 1.1710 1.0927 1.2604 1.3701 1.2671
1.0654 1.1111 1.1275 1.3028 1.3678 1.2060