Food Lion 2003 Annual Report Download - page 30
Download and view the complete annual report
Please find page 30 of the 2003 Food Lion annual report below. You can navigate through the pages in the report by either clicking on the pages listed below, or by using the keyword search tool below to find specific information within the annual report.-
 1
1 -
2
-
3
-
4
-
5
-
6
-
7
-
8
-
9
-
10
-
11
-
12
-
13
-
14
-
15
-
16
-
17
-
18
-
19
-
 20
20 -
 21
21 -
 22
22 -
 23
23 -
 24
24 -
 25
25 -
 26
26 -
 27
27 -
 28
28 -
 29
29 -
 30
30 -
 31
31 -
 32
32 -
 33
33 -
 34
34 -
 35
35 -
 36
36 -
 37
37 -
 38
38 -
 39
39 -
 40
40 -
41
-
42
-
43
-
44
-
45
-
46
-
47
-
48
-
49
-
50
-
51
-
52
-
53
-
54
-
55
-
56
-
57
-
58
-
59
-
60
-
61
-
62
-
63
-
64
-
65
-
66
-
67
-
68
-
69
-
70
-
71
-
72
-
73
-
74
-
75
-
76
-
77
-
78
-
79
-
80
 |
 |

Delhaize Group - Annual Report 2003
28
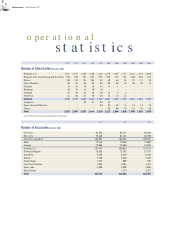
Fi n a n c i a l
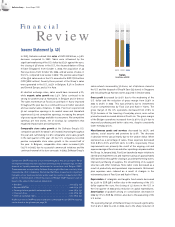
2001 2002 2003
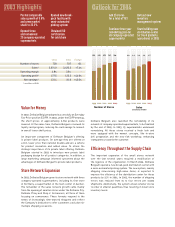
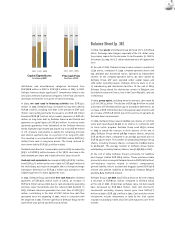
Sales
(in billions of EUR)
21.4 20.7 18.8
Income Statement (p. 40)
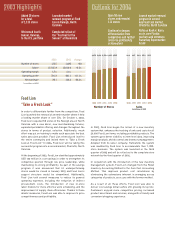
In 2003, Delhaize realized total sales of EUR 18.8 billion, a 9.0%
decrease compared to 2002. Sales were infl uenced by the
signifi cant weakening of the U.S. dollar by 16.4% against the euro,
the closing of 46 stores in the U.S., the deconsolidation of Shop
N Save (Singapore) from October 1, 2003, the acquisition of 43
Harveys stores from October 26, 2003, and 53 weeks of sales in
the U.S., compared to 52 weeks in 2002. The positive sales impact
of the 53rd sales week in the U.S. amounted to EUR 272.8 million
(USD 308.6 million). Seventy-three percent of the Group’s sales
were generated in the U.S., 19.5% in Belgium, 6.4% in Southern
and Central Europe, and 1.1% in Asia.
At identical exchange rates, sales would have increased 4.2%,
while organic sales growth was 2.4%. Sales continued to be
strong for another year at Hannaford, in Belgium and in Greece.
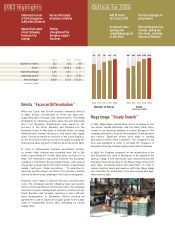
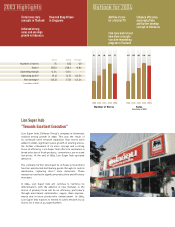
The sales momentum at Food Lion and Kash n’ Karry improved
throughout the year due to a continued focus on better execution
and successful sales initiatives. In 2003, Food Lion experienced
91 net competitive openings in its market areas and Hannaford
experienced 13 net competitive openings, increasing the amount
of grocery square footage available to consumers. Net competitive
openings are new stores, net of closings, by competitors that
negatively impact sales at existing stores.
Comparable store sales growth at the Delhaize Group’s U.S.
companies was 0.6% for 2003 (-1.0% in 2002), improving throughout
the year and culminating in 2.9% comparable store sales growth
in the last quarter of the year. All four U.S. companies recorded
positive comparable store sales growth in the second half of
the year. In Belgium, comparable store sales increased 5.6%
(+3.7% in 2002), due to successful commercial initiatives and the
continued renewal of its store concepts. In 2003, Delhaize Group’s
sales network increased by 32 stores, net of 46 stores closed in
the U.S. and the disposal of Shop N Save (35 stores) in Singapore
and including the 43 Harveys stores acquired in October 2003.
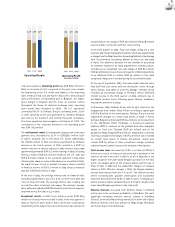
Gross profi t decreased by 10.2% due to the weakening of the
U.S. dollar and the reduction of gross margin from 25.9% in
2002 to 25.6% in 2003. This was primarily due to investments
in price competitiveness by Food Lion and Kash n’ Karry. The
gross margin of the U.S. operations decreased from 27.6% to
27.3% because of the lowering of everyday prices, more active
promotions and increased shrink at Food Lion. The gross margin
of the Belgian operations increased from 21.9% to 22.4% due to
improved purchasing and better sales mix, despite consistently
lower everyday prices.
Miscellaneous goods and services decreased by 10.5%, and
salaries, social security and pensions by 11.0%. The decrease
in absolute terms was primarily due to the weaker dollar. When
expressed as a percentage of sales, these expenses decreased
from 6.8% to 6.7%, and from 13.1% to 12.8%, respectively. These
improvements are primarily the result of the ongoing cost and
expense savings at Food Lion and other operating companies within
the Group. In January 2003, Food Lion launched a major initiative to
identify and implement cost and expense savings of approximately
USD 100 million through the closing of 41 underperforming stores,
improved purchasing of supplies, the streamlining of its support
structure and other initiatives. Store labor costs decreased as a
result of productivity and operational improvements. Retirement
plan expenses were reduced as a result of changes in the
retirements plans of Food Lion and Kash n’ Karry.
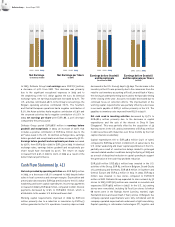
Depreciation of intangible and tangible fi xed assets decreased
by 14.9% to EUR 538.7 million due to the weakening of the U.S.
dollar against the euro, the closing of 42 stores in the U.S. in
the fi rst quarter of 2003 and a reduction in capital expenditures.
Amortization of goodwill arising on consolidation decreased in
2003 by 7.7% to EUR 85.1 million, also due to the weakening of the
U.S. dollar.
The operating margin of Delhaize Group increased signifi cantly,
from 3.9% in 2002 to 4.3% in 2003, due to the sharp reduction of
Certain non-GAAP measures are provided throughout this annual report. We do
not represent these measures as alternative measures to net earnings, or other
financial or liquidity measures determined in accordance with Belgian GAAP.
These measures as reported by Delhaize Group might differ from similarly titled
measures by other companies. We believe that these measures are important
indicators of our business and are widely used by investors, analysts and other
parties. A reconciliation of these measures to Belgian GAAP measures can be
found in the notes to the financial statements:
• Net debt ........................................................................................note 16 (p. 50)
• Adjusted EBITDA ..........................................................................note 21 (p. 52)
• Earnings before goodwill and exceptionals ................................ note 26 (p. 53)
• Free cash flow ..............................................................................note 27 (p. 53)
• Identical exchange rates ............................................................. note 28 (p. 54)
A definition of non-GAAP measures and ratios composed of non-GAAP measures
can be found in the glossary on page 76.
Re v ie w