Food Lion 2003 Annual Report Download - page 40
Download and view the complete annual report
Please find page 40 of the 2003 Food Lion annual report below. You can navigate through the pages in the report by either clicking on the pages listed below, or by using the keyword search tool below to find specific information within the annual report.-
 1
1 -
2
-
3
-
4
-
5
-
6
-
7
-
8
-
9
-
10
-
11
-
12
-
13
-
14
-
15
-
16
-
17
-
18
-
19
-
20
-
21
-
22
-
23
-
24
-
25
-
26
-
27
-
28
-
29
-
 30
30 -
 31
31 -
 32
32 -
 33
33 -
 34
34 -
 35
35 -
 36
36 -
 37
37 -
 38
38 -
 39
39 -
 40
40 -
 41
41 -
 42
42 -
 43
43 -
 44
44 -
 45
45 -
 46
46 -
 47
47 -
 48
48 -
 49
49 -
 50
50 -
51
-
52
-
53
-
54
-
55
-
56
-
57
-
58
-
59
-
60
-
61
-
62
-
63
-
64
-
65
-
66
-
67
-
68
-
69
-
70
-
71
-
72
-
73
-
74
-
75
-
76
-
77
-
78
-
79
-
80
 |
 |

Delhaize Group - Annual Report 2003
38
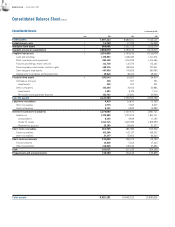
Consolidated Balance Sheet(note 1)
Consolidated Assets (in thousands of EUR)
Note 2003 2002 2001
Fixed assets 7,097,342 8,080,611 9,135,116
Establishment costs 414,750 17,376 24,599
Intangible fixed assets 3886,406 1,121,212 1,413,279
Goodwill arising on consolidation 22,886,678 3,163,132 3,445,945
Tangible fixed assets 53,203,965 3,743,324 4,216,878
Land and buildings 1,178,953 1,300,489 1,412,251
Plant, machinery and equipment 895,458 1,104,226 1,214,484
Fixtures and fittings, motor vehicles 144,728 125,576 113,405
Financing leases and similar contract rights 468,219 598,994 727,641
Other tangible fixed assets 487,959 575,600 699,765
Capital work in progress and prepayments 28,648 38,439 49,332
Financial fixed assets 6105,543 35,567 34,415
Companies at equity 238 557 531
Investments 238 557 531
Other companies 105,305 35,010 33,884
Investments 1,603 9,176 7,115
Receivables and guarantee deposits 103,702 25,834 26,769
Current assets 2,421,760 2,759,521 2,950,700
Long-term receivables 9,910 16,837 21,159
Other receivables 3,779 7,035 6,077
Deferred taxation 6,131 9,802 15,082
Inventories and work in progress 1,376,880 1,707,673 1,861,741
Inventories 1,376,880 1,707,673 1,861,741
Consumables 8,450 9,689 11,165
Goods for resale 1,342,145 1,667,580 1,819,299
Payments to account 26,285 30,404 31,277
Short-term receivables 452,765 486,989 522,602
Trade receivables 415,288 431,137 459,257
Other receivables 37,477 55,852 63,345
Short-term investments 231,006 106,472 45,139
Treasury shares 12,938 5,942 17,445
Other investments 218,068 100,530 27,694
Cash 241,031 317,210 364,160
Prepayments and accrued income 110,168 124,340 135,899
Total assets 9,519,102 10,840,132 12,085,816