Dollar Tree 2007 Annual Report Download - page 48
Download and view the complete annual report
Please find page 48 of the 2007 Dollar Tree annual report below. You can navigate through the pages in the report by either clicking on the pages listed below, or by using the keyword search tool below to find specific information within the annual report.-
 1
1 -
2
-
3
-
4
-
5
-
6
-
7
-
8
-
9
-
10
-
11
-
12
-
13
-
14
-
15
-
16
-
17
-
18
-
19
-
20
-
21
-
22
-
23
-
24
-
25
-
26
-
27
-
28
-
29
-
30
-
31
-
32
-
33
-
34
-
35
-
36
-
37
-
 38
38 -
 39
39 -
 40
40 -
 41
41 -
 42
42 -
 43
43 -
 44
44 -
 45
45 -
 46
46 -
 47
47 -
 48
48 -
 49
49 -
 50
50 -
 51
51 -
 52
52
 |
 |

46
DOLLAR TREE, INC. • 2007 ANNUAL REPORT
Notes to Consolidated Financial Statements continued
In 2005, the Company granted 40,000 RSUs from
the EOEP to certain officers of the Company, contin-
gent on the Company meeting certain performance
targets in 2005 and future service of these officers
through various points through July 2007. The
Company met these performance targets in fiscal
2005; therefore, the fair value of these RSUs of $1.0
million was expensed over the service period. The fair
value of these RSUs was determined using the
Company’s closing stock price January 28, 2006 (the
last day of fiscal 2005), when the performance targets
were satisfied. The Company recognized $0.3 million
and $0.7 million, of expense related to these RSUs in
2006 and 2005, respectively. The amount recognized
in 2007 was less than $0.1 million.
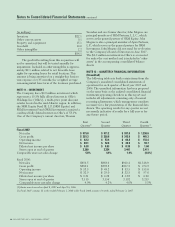
The following tables summarize the Company’s various option plans and information about options out-
standing at February 2, 2008 and changes during the year then ended.
Stock Option Activity
February 2, 2008
Weighted
Average Weighted Aggregate
Per Share Average Intrinsic
Exercise Remaining Value (in
Shares Price Term millions)
Outstanding, beginning of period 4,466,041 $25.96
Granted 386,490 38.17
Exercised (2,674,857) 25.46
Forfeited (87,760) 31.00
Outstanding, end of period 2,089,914 $28.63 5.5 $ —
Options vested and expected to vest
at February 2, 2008 2,061,008 $28.58 5.5 $ —
Options exercisable at end of period 1,557,234 $26.71 4.4 $1.7
Options Outstanding Options Exercisable
Options Weighted Weighted Options Weighted
Range of Outstanding Average Average Exercisable Average
Exercise at February 2, Remaining Exercise at February 2, Exercise
Prices 2008 Contractual Life Price 2008 Price
$0.86 3,072 N/A $0.86 3,072 $0.86
$10.99 to $21.28 307,534 4.3 19.43 307,534 19.43
$21.29 to $29.79 935,616 5.3 25.83 736,436 25.35
$29.80 to $42.56 843,692 6.1 35.20 510,192 33.21
$0.86 to $42.56 2,089,914 5.5 28.63 1,557,234 26.71
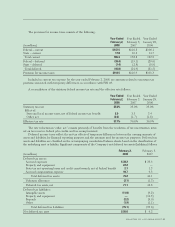
The intrinsic value of options exercised during 2007, 2006 and 2005 was approximately $32.8 million, $13.1
million and $2.8 million, respectively.
Restricted Stock
The Company granted 323,320, 277,347 and 252,936
RSUs, net of forfeitures in 2007, 2006 and 2005,
respectively, from the EIP and the EOEP to the
Company’s employees and officers. The fair value of all
of these RSUs is being expensed ratably over the three-
year vesting periods, or a shorter period based on the
retirement eligibility of the grantee. The fair value was
determined using the Company’s closing stock price on
the date of grant. The Company recognized $7.7 mil-
lion, $4.5 million and $1.7 million of expense related
to these RSUs during 2007, 2006 and 2005. As of
February 2, 2008, there was approximately $11.8 million
of total unrecognized compensation expense related to
these RSUs which is expected to be recognized over a
weighted average period of 22 months.