Dollar Tree 2007 Annual Report Download - page 39
Download and view the complete annual report
Please find page 39 of the 2007 Dollar Tree annual report below. You can navigate through the pages in the report by either clicking on the pages listed below, or by using the keyword search tool below to find specific information within the annual report.-
 1
1 -
2
-
3
-
4
-
5
-
6
-
7
-
8
-
9
-
10
-
11
-
12
-
13
-
14
-
15
-
16
-
17
-
18
-
19
-
20
-
21
-
22
-
23
-
24
-
25
-
26
-
27
-
28
-
 29
29 -
 30
30 -
 31
31 -
 32
32 -
 33
33 -
 34
34 -
 35
35 -
 36
36 -
 37
37 -
 38
38 -
 39
39 -
 40
40 -
 41
41 -
 42
42 -
 43
43 -
 44
44 -
 45
45 -
 46
46 -
 47
47 -
 48
48 -
 49
49 -
50
-
51
-
52
 |
 |

DOLLAR TREE, INC. • 2007 ANNUAL REPORT
37
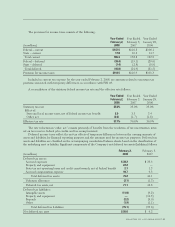
The provision for income taxes consists of the following:
Year Ended Year Ended Year Ended
February 2, February 3, January 28,
(in millions) 2008 2007 2006
Federal – current $147.5 $116.2 $108.1
State – current 17.8 16.6 14.7
Total current 165.3 132.8 122.8
Federal – deferred (39.4) (19.1) (20.6)
State – deferred (7.4) (2.8) (0.9)
Total deferred (46.8) (21.9) (21.5)
Provision for income taxes $118.5 $110.9 $101.3
Included in current tax expense for the year ended February 2, 2008, are amounts related to uncertain tax
positions associated with temporary differences, in accordance with FIN 48.
A reconciliation of the statutory federal income tax rate and the effective rate follows:
Year Ended Year Ended Year Ended
February 2, February 3, January 28,
2008 2007 2006
Statutory tax rate 35.0% 35.0% 35.0%
Effect of:
State and local income taxes, net of federal income tax benefit 2.9 3.3 3.4
Other, net (0.8) (1.7) (1.6)
Effective tax rate 37.1% 36.6% 36.8%
The rate reduction in “other, net” consists primarily of benefits from the resolution of tax uncertainties, inter-
est on tax reserves, federal jobs credits and tax exempt interest.
Deferred income taxes reflect the net tax effects of temporary differences between the carrying amounts of
assets and liabilities for financial reporting purposes and the amounts used for income tax purposes. Deferred tax
assets and liabilities are classified on the accompanying consolidated balance sheets based on the classification of
the underlying asset or liability. Significant components of the Company’s net deferred tax assets (liabilities) follows:
February 2, February 3,
(in millions) 2008 2007
Deferred tax assets:
Accrued expenses $ 38.2 $ 33.5
Property and equipment 22.2 —
State tax net operating losses and credit carryforwards, net of federal benefit 2.1 1.3
Accrued compensation expense 10.7 9.3
Total deferred tax assets 73.2 44.1
Valuation allowance (2.1) (1.3)
Deferred tax assets, net 71.1 42.8
Deferred tax liabilities:
Intangible assets (11.0) (9.2)
Property and equipment —(14.3)
Prepaids (2.2) (9.0)
Other (1.9) (1.1)
Total deferred tax liabilities (15.1) (33.6)
Net deferred tax asset $ 56.0 $ 9.2