Dollar Tree 2007 Annual Report Download - page 19
Download and view the complete annual report
Please find page 19 of the 2007 Dollar Tree annual report below. You can navigate through the pages in the report by either clicking on the pages listed below, or by using the keyword search tool below to find specific information within the annual report.-
 1
1 -
2
-
3
-
4
-
5
-
6
-
7
-
8
-
 9
9 -
 10
10 -
 11
11 -
 12
12 -
 13
13 -
 14
14 -
 15
15 -
 16
16 -
 17
17 -
 18
18 -
 19
19 -
 20
20 -
 21
21 -
 22
22 -
 23
23 -
 24
24 -
 25
25 -
 26
26 -
 27
27 -
 28
28 -
 29
29 -
30
-
31
-
32
-
33
-
34
-
35
-
36
-
37
-
38
-
39
-
40
-
41
-
42
-
43
-
44
-
45
-
46
-
47
-
48
-
49
-
50
-
51
-
52
 |
 |

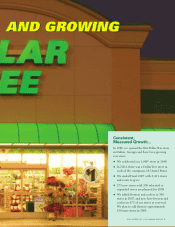
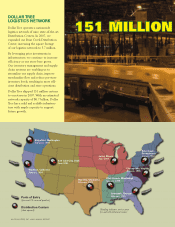
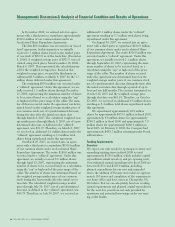
DOLLAR TREE, INC. • 2007 ANNUAL REPORT
17
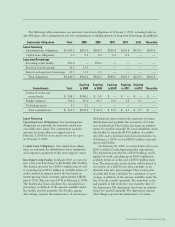
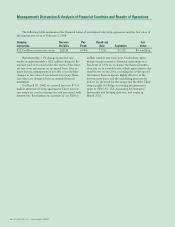
Results of Operations
The following table expresses items from our consolidated statements of operations, as a percentage of net sales:
Year Ended Year Ended Year Ended
February 2, February 3, January 28,
2008 2007 2006
Net sales 100.0% 100.0% 100.0%
Cost of sales 65.6% 65.8% 65.5%
Gross profit 34.4% 34.2% 34.5%
Selling, general and administrative expenses 26.6% 26.4% 26.2%
Operating income 7.8% 7.8% 8.3%
Interest income 0.1% 0.2% 0.2%
Interest expense (0.4%) (0.4%) (0.4%)
Income before income taxes 7.5% 7.6% 8.1%
Provision for income taxes (2.8%) (2.8%) (3.0%)
Net income 4.7% 4.8% 5.1%
Fiscal year ended February 2, 2008 compared to fiscal year
ended February 3, 2007
Net Sales. Net sales increased 6.9%, or $273.2 million,
in 2007 compared to 2006, resulting primarily from
sales in our new and expanded stores. Our sales
increase was also impacted by a 2.7% increase in com-
parable store net sales for the year. This increase is
based on the comparable 52-weeks for both years.
These increases were partially offset by an extra week
of sales in 2006 due to the 53-week retail calendar for
2006. On a comparative 52-week basis, sales increased
approximately 8.8% in 2007 compared to 2006.
Comparable store net sales are positively affected by
our expanded and relocated stores, which we include
in the calculation, and, to a lesser extent, are negative-
ly affected when we open new stores or expand stores
near existing ones.
The following table summarizes the components
of the changes in our store count for fiscal years ended
February 2, 2008 and February 3, 2007.
February 2, February 3,
2008 2007
New stores 208 190
Deal$ acquisition —138
Acquired leases 32 21
Expanded or relocated stores 102 85
Closed stores (48) (44)
Of the 2.1 million selling square foot increase in
2007 approximately 0.4 million was added by expand-
ing existing stores.
Gross Profit. Gross profit margin increased to 34.4%
in 2007 compared to 34.2% in 2006. The increase was
primarily due to a 50 basis point decrease in merchan-
dise cost, including inbound freight, due to improved
initial mark-up in many categories in the current year.
This decrease was partially offset by a 40 basis point
increase in occupancy costs due to the loss of leverage
from the extra week of sales in the prior year and the
lower comparable store net sales in the current year.
Selling, General and Administrative Expenses. Selling,
general and administrative expenses, as a percentage of
net sales, increased to 26.6% for 2007 compared to
26.4% for 2006. The increase is primarily due to the
following:
• Operating and corporate expenses increased
approximately 25 basis points due to increased
debit and credit fees resulting from increased
debit transactions in the current year and the roll-
out of VISA credit at October 31, 2007. Also, in
2006, we had approximately 10 basis points of
income related to early lease terminations.
• Occupancy costs increased 15 basis points prima-
rily due to increased repairs and maintenance
costs in the current year.