Dollar Tree 2007 Annual Report Download - page 20
Download and view the complete annual report
Please find page 20 of the 2007 Dollar Tree annual report below. You can navigate through the pages in the report by either clicking on the pages listed below, or by using the keyword search tool below to find specific information within the annual report.-
 1
1 -
2
-
3
-
4
-
5
-
6
-
7
-
8
-
9
-
 10
10 -
 11
11 -
 12
12 -
 13
13 -
 14
14 -
 15
15 -
 16
16 -
 17
17 -
 18
18 -
 19
19 -
 20
20 -
 21
21 -
 22
22 -
 23
23 -
 24
24 -
 25
25 -
 26
26 -
 27
27 -
 28
28 -
 29
29 -
 30
30 -
31
-
32
-
33
-
34
-
35
-
36
-
37
-
38
-
39
-
40
-
41
-
42
-
43
-
44
-
45
-
46
-
47
-
48
-
49
-
50
-
51
-
52
 |
 |

18
DOLLAR TREE, INC. • 2007 ANNUAL REPORT
Management’s Discussion & Analysis of Financial Condition and Results of Operations
• Partially offsetting these increases was an approxi-
mate 15 basis point decrease in depreciation
expense due to the expiration of the depreciable
life on much of the supply chain hardware and
software placed in service in 2002.
Operating Income. Due to the reasons discussed
above, operating income margin was 7.8% in 2007
and 2006.
Income Taxes. Our effective tax rate was 37.1% in
2007 compared to 36.6% in 2006. The increase in the
rate for 2007 reflects a reduction of tax-exempt inter-
est income in the current year due to lower invest-
ment levels resulting from increased share repurchase
activity and an increase in tax reserves in accordance
with the Financial Accounting Standards Board’s
Financial Interpretation No. 48, Accounting for
Uncertainty in Income Taxes. These increases more than
offset a slight decrease in our net state tax rate.
Fiscal year ended February 3, 2007 compared to fiscal year
ended January 28, 2006
Net Sales. Net sales increased 16.9%, or $575.5 mil-
lion, in 2006 compared to 2005, resulting from sales
in our new and expanded stores, including 138 Deal$
stores acquired in March 2006 and the 53 weeks of
sales in 2006 versus 52 weeks in 2005, which account-
ed for approximately $70 million of the increase. Our
sales increase was also impacted by a 4.6% increase in
comparable store net sales for the year. This increase is
based on a 53-week comparison for both periods.
Comparable store net sales are positively affected by
our expanded and relocated stores, which we include
in the calculation, and, to a lesser extent, are negative-
ly affected when we open new stores or expand stores
near existing ones.
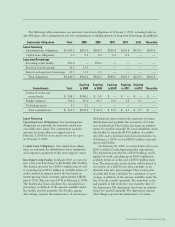
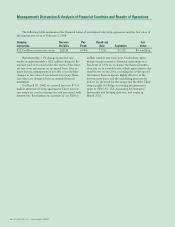
The following table summarizes the components
of the changes in our store count for fiscal years ended
February 3, 2007 and January 28, 2006.
February 3, January 28,
2007 2006
New stores 190 197
Deal$ acquisition 138 —
Acquired leases 21 35
Expanded or relocated stores 85 93
Closed stores (44) (53)
Of the 3.3 million selling square foot increase in
2006, approximately 1.2 million resulted from the
acquisition of the Deal$ stores and 0.4 million was
added by expanding existing stores.
Gross Profit. Gross profit margin decreased to 34.2%
in 2006 compared to 34.5% in 2005. The decrease
was primarily due to a 35 basis point increase in mer-
chandise cost, including inbound freight. This increase
in merchandise cost was due to a slight shift in mix to
more consumables, which have a lower margin, higher
cost merchandise at our Deal$ stores and increased
inbound domestic freight costs.
Selling, General and Administrative Expenses. Selling,
general and administrative expenses, as a percentage of
net sales, increased to 26.4% for 2006 as compared to
26.2% for 2005. The increase is primarily due to the
following:
• Payroll and benefit related costs increased 35 basis
points due to increased incentive compensation
costs resulting from better overall company per-
formance in 2006 as compared to 2005 and
increased stock compensation expense, partially off-
set by lower workers’ compensation costs in 2006.
• Operating and corporate expenses decreased 10
basis points primarily as the result of payments
received for early lease terminations in 2006.
Operating Income. Due to the reasons discussed
above, operating income margin decreased to 7.8% in
2006 compared to 8.3% in 2005.
Income Taxes. Our effective tax rate was 36.6% in
2006 compared to 36.8% in 2005. The decreased tax
rate for 2006 was due primarily to increased tax-
exempt interest on certain of our investments in 2006.
Liquidity and Capital Resources
Our business requires capital to build and open new
stores, expand our distribution network and operate
existing stores. Our working capital requirements for
existing stores are seasonal and usually reach their
peak in September and October. Historically, we have
satisfied our seasonal working capital requirements for
existing stores and have funded our store opening and
distribution network expansion programs from inter-
nally generated funds and borrowings under our credit
facilities.