Dollar Tree 2007 Annual Report Download - page 37
Download and view the complete annual report
Please find page 37 of the 2007 Dollar Tree annual report below. You can navigate through the pages in the report by either clicking on the pages listed below, or by using the keyword search tool below to find specific information within the annual report.-
 1
1 -
2
-
3
-
4
-
5
-
6
-
7
-
8
-
9
-
10
-
11
-
12
-
13
-
14
-
15
-
16
-
17
-
18
-
19
-
20
-
21
-
22
-
23
-
24
-
25
-
26
-
 27
27 -
 28
28 -
 29
29 -
 30
30 -
 31
31 -
 32
32 -
 33
33 -
 34
34 -
 35
35 -
 36
36 -
 37
37 -
 38
38 -
 39
39 -
 40
40 -
 41
41 -
 42
42 -
 43
43 -
 44
44 -
 45
45 -
 46
46 -
 47
47 -
48
-
49
-
50
-
51
-
52
 |
 |

DOLLAR TREE, INC. • 2007 ANNUAL REPORT
35
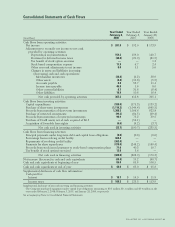
Consolidated Statements of Cash Flows. SFAS 123R
requires cash flows resulting from the tax deductions
in excess of the tax benefits of the related compensa-
tion cost recognized in the financial statements (excess
tax benefits) to be classified as financing cash flows.
Thus, the Company has classified the $13.0 million
and $5.6 million of excess tax benefits recognized in
2007 and 2006, respectively, as financing cash flows.
Excess tax benefits of $1.2 million recognized in 2005
prior to the adoption of SFAS 123R, are classified as
operating cash flows.
If the accounting provisions of SFAS 123 had
been applied to 2005, the Company’s net income and
net income per share would have been reduced to the
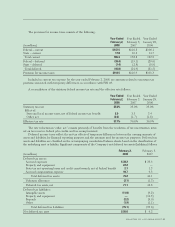
pro forma amounts indicated in the following table:
Year Ended
January 28,
(in millions, except per share data) 2006
Net income as reported $173.9
Add: Total stock-based employee
compensation expense included in
net income, net of related tax effects 1.5
Deduct: Total stock-based employee
compensation expense determined
under fair value based method,
net of related tax effects (18.2)
$157.2
Net income per share:
Basic, as reported $ 1.61
Basic, pro forma under FAS 123 1.45
Diluted, as reported $ 1.60
Diluted, pro forma under FAS 123 1.44
On December 15, 2005, the Compensation
Committee of the Board of Directors of the Company
approved the acceleration of the vesting date of all
previously issued, outstanding and unvested options
under all current stock option plans, including the
1995 Stock Incentive Plan, the 2003 Equity Incentive
Plan and the 2004 Executive Officer Equity Incentive
Plan (EOEP), effective as of December 15, 2005. At
the effective date, almost all of these options had exer-
cise prices higher than the actual stock price. The
Company made the decision to accelerate vesting of
these options to give employees increased perform-
ance incentives and to enhance current retention. This
decision also eliminated non-cash compensation
expense that would have been recorded in future peri-
ods following the Company’s adoption of SFAS 123R
on January 29, 2006. Compensation expense, as deter-
mined at the time of the accelerated vesting, has been
reduced by $14.9 million, over a period of four years
during which the options would have vested, as a
result of the option acceleration program. This amount
is net of compensation expense of $0.1 million recog-
nized in fiscal 2005 for estimated forfeiture of certain
(in the money) options.
The Company recognizes expense related to the
fair value of restricted stock units (RSUs) over the req-
uisite service period. The fair value of the RSUs is
determined using the closing price of the Company’s
common stock on the date of grant.
On March 14, 2008, the Board of Directors grant-
ed approximately 0.3 million restricted stock units and
options to purchase 0.4 million shares of the
Company’s common stock under the Company’s
Equity Incentive Plan and the EOEP.
Net Income Per Share
Basic net income per share has been computed by
dividing net income by the weighted average number
of shares outstanding. Diluted net income per share
reflects the potential dilution that could occur assum-
ing the inclusion of dilutive potential shares and has
been computed by dividing net income by the weight-
ed average number of shares and dilutive potential
shares outstanding. Dilutive potential shares include all
outstanding stock options and unvested restricted
stock, excluding certain performance based restricted
stock grants, after applying the treasury stock method.
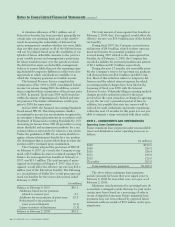
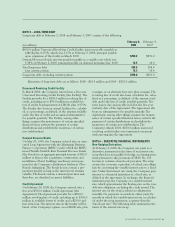
NOTE 2 – BALANCE SHEET COMPONENTS
Other Intangibles, Net
Intangibles, net, as of February 2, 2008 and February 3,
2007 consist of the following:
February 2, February 3,
(in millions) 2008 2007
Non-competition agreements $ 6.4 $ 6.4
Accumulated amortization (5.9) (5.1)
Non-competition agreements,
net 0.5 1.3
Favorable lease rights 25.1 19.0
Accumulated amortization (11.1) (7.0)
Favorable lease rights, net 14.0 12.0
Total other intangibles, net $14.5 $13.3
Non-Competition Agreements
The Company has entered into non-competition
agreements with certain former executives of certain
acquired entities. These assets are being amortized over
the legal term of the individual agreements, ranging
from five to ten years.