Dollar Tree 2007 Annual Report Download - page 38
Download and view the complete annual report
Please find page 38 of the 2007 Dollar Tree annual report below. You can navigate through the pages in the report by either clicking on the pages listed below, or by using the keyword search tool below to find specific information within the annual report.-
 1
1 -
2
-
3
-
4
-
5
-
6
-
7
-
8
-
9
-
10
-
11
-
12
-
13
-
14
-
15
-
16
-
17
-
18
-
19
-
20
-
21
-
22
-
23
-
24
-
25
-
26
-
27
-
 28
28 -
 29
29 -
 30
30 -
 31
31 -
 32
32 -
 33
33 -
 34
34 -
 35
35 -
 36
36 -
 37
37 -
 38
38 -
 39
39 -
 40
40 -
 41
41 -
 42
42 -
 43
43 -
 44
44 -
 45
45 -
 46
46 -
 47
47 -
 48
48 -
49
-
50
-
51
-
52
 |
 |

36
DOLLAR TREE, INC. • 2007 ANNUAL REPORT
Notes to Consolidated Financial Statements continued
Other Assets, Net
Other assets, net includes $47.6 million and $39.2
million at February 2, 2008 and February 3, 2007,
respectively of restricted investments. The Company
purchased these restricted investments to collateralize
long-term insurance obligations. These investments
replaced higher cost stand by letters of credit and
surety bonds. These investments consist primarily of
government-sponsored municipal bonds, similar to our
short-term investments. These investments are classi-
fied as available for sale and are recorded at fair value,
which approximates cost.
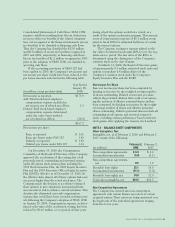
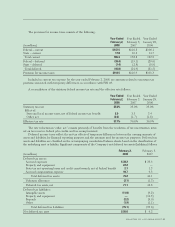
Other Current Liabilities
Other current liabilities as of February 2, 2008 and
February 3, 2007 consist of accrued expenses for the
following:
February 2, February 3,
(in millions) 2008 2007
Compensation and benefits $ 45.5 $ 43.5
Taxes (other than income taxes) 16.3 19.5
Insurance 27.6 26.8
Other 54.2 42.2
Total other current liabilities $143.6 $132.0
Fair Value of Financial Instruments
The carrying values of cash and cash equivalents, other
current assets, accounts payable and other current lia-
bilities approximate fair value because of the short
maturity of these instruments. The carrying values of
other long-term financial assets and liabilities, exclud-
ing restricted investments, approximate fair value
because they are recorded using discounted future
cash flows or quoted market rates. Short-term invest-
ments and restricted investments are carried at fair
value, which approximates cost, in accordance with
SFAS No. 115, Accounting for Certain Investments in
Debt and Equity Securities.
The carrying value of the Company’s long-term
debt approximates its fair value because the debt’s
interest rates vary with market interest rates.
Favorable Lease Rights
In 2007 and 2006, the Company acquired favorable
lease rights for operating leases for retail locations
from third parties, including the acquired favorable
lease rights in its acquisition of 138 Deal$ stores (see
Note 10). The Company’s favorable lease rights are
amortized on a straight-line basis to rent expense over
the remaining initial lease terms, which expire at vari-
ous dates through 2016. The weighted average life
remaining on the favorable lease rights at February 2,
2008 is 50 months.
Amortization expense related to the non-competi-
tion agreements and favorable lease rights was $5.4
million, $4.4 million and $3.3 million for the years
ended February 2, 2008, February 3, 2007 and January
28, 2006, respectively. Estimated annual amortization
expense for the next five years follows: 2008 - $4.9
million, 2009 - $3.2 million, 2010 - $2.5 million, 2011
- $1.9 million, and 2012 - $1.1 million.
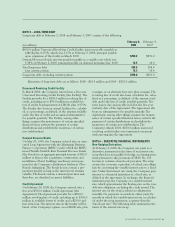
Property, Plant and Equipment, Net
Property, plant and equipment, net, as of February 2,
2008 and February 3, 2007 consists of the following:
February 2, February 3,
(in millions) 2008 2007
Land $ 29.4 $ 29.4
Buildings 172.7 154.7
Improvements 535.1 482.3
Furniture, fixtures and
equipment 785.0 708.6
Construction in progress 52.9 38.3
Total property, plant
and equipment 1,575.1 1,413.3
Less: accumulated
depreciation
and amortization 831.5 698.0
Total property, plant
and equipment, net $ 743.6 $ 715.3
NOTE 3 – INCOME TAXES
Total income taxes were allocated as follows:
Year Ended Year Ended Year Ended
February 2, February 3, January 28,
(in millions) 2008 2007 2006
Income from continuing operations $118.5 $110.9 $101.3
Accumulated other comprehensive income, marking derivative
financial instruments to fair value —— 0.2
Stockholders’ equity, tax benefit on exercise of stock options (13.0) (5.6) (1.2)
$105.5 $105.3 $100.3