Delta Airlines 2005 Annual Report Download - page 28
Download and view the complete annual report
Please find page 28 of the 2005 Delta Airlines annual report below. You can navigate through the pages in the report by either clicking on the pages listed below, or by using the keyword search tool below to find specific information within the annual report.-
 1
1 -
2
-
3
-
4
-
5
-
6
-
7
-
8
-
9
-
10
-
11
-
12
-
13
-
14
-
15
-
16
-
17
-
 18
18 -
 19
19 -
 20
20 -
 21
21 -
 22
22 -
 23
23 -
 24
24 -
 25
25 -
 26
26 -
 27
27 -
 28
28 -
 29
29 -
 30
30 -
 31
31 -
 32
32 -
 33
33 -
 34
34 -
 35
35 -
 36
36 -
 37
37 -
 38
38 -
39
-
40
-
41
-
42
-
43
-
44
-
45
-
46
-
47
-
48
-
49
-
50
-
51
-
52
-
53
-
54
-
55
-
56
-
57
-
58
-
59
-
60
-
61
-
62
-
63
-
64
-
65
-
66
-
67
-
68
-
69
-
70
-
71
-
72
-
73
-
74
-
75
-
76
-
77
-
78
-
79
-
80
-
81
-
82
-
83
-
84
-
85
-
86
-
87
-
88
-
89
-
90
-
91
-
92
-
93
-
94
-
95
-
96
-
97
-
98
-
99
-
100
-
101
-
102
-
103
-
104
-
105
-
106
-
107
-
108
-
109
-
110
-
111
-
112
-
113
-
114
-
115
-
116
-
117
-
118
-
119
-
120
-
121
-
122
-
123
-
124
-
125
-
126
-
127
-
128
-
129
-
130
-
131
-
132
-
133
-
134
-
135
-
136
-
137
-
138
-
139
-
140
-
141
-
142
 |
 |
Table of Contents
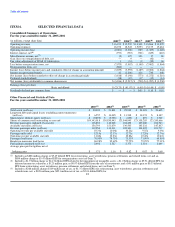
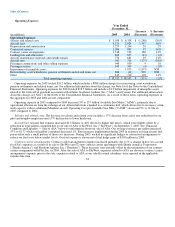
ITEM 6. SELECTED FINANCIAL DATA
Consolidated Summary of Operations
For the years ended December 31, 2005-2001
(in millions, except share data) 2005(1) 2004(2) 2003(3) 2002(4) 2001(5)
Operating revenues $ 16,191 $ 15,235 $ 14,308 $ 13,866 $ 13,879
Operating expenses 18,192 18,543 15,093 15,175 15,481
Operating income (loss) (2,001) (3,308) (785) (1,309) (1,602)
Interest expense, net(6) (973) (787) (721) (629) (410)
Miscellaneous income, net(7) (2) 125 326 17 80
Gain (loss) on extinguishment of debt, net — 9 — (42) —
Fair value adjustments of SFAS 133 derivatives 1 (31) (9) (39) 68
Loss before reorganization items, net (2,975) (3,992) (1,189) (2,002) (1,864)
Reorganization items, net (884) — — — —
Income (loss) before income taxes and cumulative effect of change in accounting principle (3,859) (3,992) (1,189) (2,002) (1,864)
Income tax (provision) benefit 41 (1,206) 416 730 648
Net income (loss) before cumulative effect of change in accounting principle (3,818) (5,198) (773) (1,272) (1,216)
Preferred stock dividends (18) (19) (17) (15) (14)
Net income (loss) attributable to common shareowners $ (3,836) $ (5,217) $ (790) $ (1,287) $ (1,230)
Earnings (loss) per share
Basic and diluted $ (23.75) $ (41.07) $ (6.40) $ (10.44) $ (9.99)
Dividends declared per common share $ — $ — $ 0.05 $ 0.10 $ 0.10
Other Financial and Statistical Data
For the years ended December 31, 2005-2001
2005(1) 2004(2) 2003(3) 2002(4) 2001(5)
Total assets (millions) $ 20,039 $ 21,801 $ 25,939 $ 24,303 $ 23,605
Long-term debt and capital leases (excluding current maturities)
(millions) $ 6,557 $ 13,005 $ 11,538 $ 10,174 $ 8,347
Shareowners' (deficit) equity (millions) $ (9,895) $ (5,796) $ (659) $ 893 $ 3,769
Shares of common stock outstanding at year end 189,343,018 139,830,443 123,544,945 123,359,205 123,245,666
Revenue passengers enplaned (thousands) 118,853 110,000 104,452 107,048 104,943
Available seat miles (millions) 156,793 151,679 139,505 145,232 147,837
Revenue passenger miles (millions) 119,954 113,311 102,301 104,422 101,717
Operating revenue per available seat mile 10.33¢ 10.04¢ 10.26¢ 9.55¢ 9.39¢
Passenger mile yield 12.19¢ 12.17¢ 12.73¢ 12.26¢ 12.74¢
Operating cost per available seat mile 11.60¢ 12.23¢ 10.82¢ 10.45¢ 10.47¢
Passenger load factor 76.50% 74.70% 73.33% 71.90% 68.80%
Breakeven passenger load factor 86.98% 92.62% 77.75% 79.25% 77.31%
Fuel gallons consumed (millions) 2,492 2,527 2,370 2,514 2,649
Average price per fuel gallon, net of
hedging gains
$ 1.71
$ 1.16
$ 0.82
$ 0.67
$ 0.69
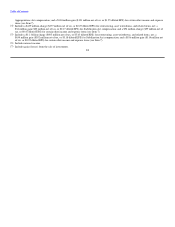
(1) Includes an $888 million charge or $5.49 diluted EPS for restructuring, asset writedowns, pension settlements and related items, net and an
$884 million charge or $5.47 diluted EPS for reorganization costs (see Item 7).
(2) Includes a $1.9 billion charge or $14.76 diluted EPS related to the impairment of intangible assets; a $1.2 billion charge or $9.51 diluted EPS for
deferred income tax valuation; a $123 million gain, or $0.97 diluted EPS from the sale of investments; and a $41 million gain or $0.33 diluted
EPS from restructuring, asset writedowns, pension settlements and related items, net (see Item 7).
(3) Includes a $268 million charge ($169 million net of tax, or $1.37 diluted EPS) for restructuring, asset writedowns, pension settlements and
related items, net; a $398 million gain ($251 million net of tax, or $2.03 diluted EPS) for
23