Delta Airlines 2005 Annual Report Download - page 120
Download and view the complete annual report
Please find page 120 of the 2005 Delta Airlines annual report below. You can navigate through the pages in the report by either clicking on the pages listed below, or by using the keyword search tool below to find specific information within the annual report.-
 1
1 -
2
-
3
-
4
-
5
-
6
-
7
-
8
-
9
-
10
-
11
-
12
-
13
-
14
-
15
-
16
-
17
-
18
-
19
-
20
-
21
-
22
-
23
-
24
-
25
-
26
-
27
-
28
-
29
-
30
-
31
-
32
-
33
-
34
-
35
-
36
-
37
-
38
-
39
-
40
-
41
-
42
-
43
-
44
-
45
-
46
-
47
-
48
-
49
-
50
-
51
-
52
-
53
-
54
-
55
-
56
-
57
-
58
-
59
-
60
-
61
-
62
-
63
-
64
-
65
-
66
-
67
-
68
-
69
-
70
-
71
-
72
-
73
-
74
-
75
-
76
-
77
-
78
-
79
-
80
-
81
-
82
-
83
-
84
-
85
-
86
-
87
-
88
-
89
-
90
-
91
-
92
-
93
-
94
-
95
-
96
-
97
-
98
-
99
-
100
-
101
-
102
-
103
-
104
-
105
-
106
-
107
-
108
-
109
-
 110
110 -
 111
111 -
 112
112 -
 113
113 -
 114
114 -
 115
115 -
 116
116 -
 117
117 -
 118
118 -
 119
119 -
 120
120 -
 121
121 -
 122
122 -
 123
123 -
 124
124 -
 125
125 -
 126
126 -
 127
127 -
 128
128 -
 129
129 -
 130
130 -
131
-
132
-
133
-
134
-
135
-
136
-
137
-
138
-
139
-
140
-
141
-
142
 |
 |

Table of Contents
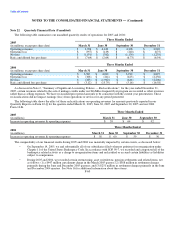
NOTES TO THE CONSOLIDATED FINANCIAL STATEMENTS — (Continued)
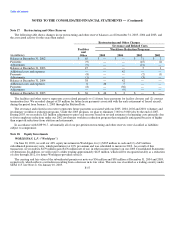
Worldspan redeemed the subordinated promissory note for $36 million, which represented the carrying value of the note as of
December 31, 2004.
Our equity earnings from this investment totaled $18 million for the year ended December 31, 2003. We also received cash
dividends from Worldspan of $44 million for the year ended December 31, 2003.
Worldspan provides us with computer reservation and related services for which we paid approximately $90 million for the six-
months ended June 30, 2003. As discussed above, we sold our equity interest in Worldspan on June 30, 2003.
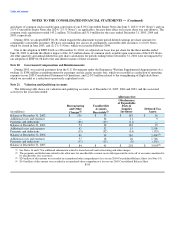
Orbitz, Inc. ("Orbitz")
During November 2004, we sold our remaining ownership and voting interest in Orbitz for approximately $143 million. We
recognized a gain of approximately $123 million on this transaction in gain from sale of investments, net.
During December 2003, Orbitz completed its initial public offering and the founding airlines of Orbitz, including us, sold a portion
of their Orbitz shares. We received $33 million from our sale of Orbitz shares. Additionally, we recorded (1) a SAB 51 gain of
$18 million, net of tax, in additional paid-in capital on our Consolidated Balance Sheet (see Note 2 for our SAB 51 accounting policy);
(2) a $28 million gain ($17 million net of tax) in other income (expense) on our Consolidated Statement of Operations from our sale of
Orbitz shares; and (3) a $4 million loss ($2 million net of tax) in other income (expense) on our Consolidated Statement of Operations
from previously unrecognized Orbitz losses since our recorded investment in Orbitz was zero prior to its initial public offering.
As a result of our sale of a portion of our Orbitz shares in December 2003, we had a 13% ownership interest and an 18% voting
interest in Orbitz. Prior to that transaction, we had an 18% ownership and voting interest in Orbitz. We accounted for our investment
in Orbitz under the equity method because we had the ability to exercise significant influence, but not control, over the financial and
operating policies of Orbitz. This ability was evidenced by, among other things, our right to appoint at least one of our senior officers
to the Board of Directors of Orbitz.
For the years ended December 31, 2004 and 2003, the gains (losses) recorded from our investment in Orbitz were not material to
our Consolidated Statements of Operations.
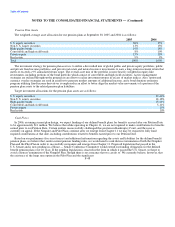
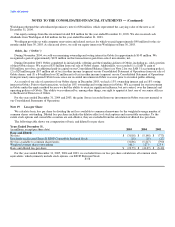
Note 19. Loss per Share
We calculate basic loss per share by dividing the net loss available to common shareowners by the weighted average number of
common shares outstanding. Diluted loss per share includes the dilutive effects of stock options and convertible securities. To the
extent stock options and convertible securities are anti-dilutive, they are excluded from the calculation of diluted loss per share.
The following table shows our computation of basic and diluted loss per share:
Years Ended December 31,
(in millions, except per share data) 2005 2004 2003
Basic and diluted:
Net loss $ (3,818) $ (5,198) $ (773)
Dividends on allocated Series B ESOP Convertible Preferred Stock (18) (19) (17)
Net loss available to common shareowners (3,836) (5,217) (790)
Weighted average shares outstanding 161.5 127.0 123.4
Basic and diluted loss per share $ (23.75) $ (41.07) $ (6.40)
For the years ended December 31, 2005, 2004 and 2003, we excluded from our loss per share calculations all common stock
equivalents, which primarily include stock options, our ESOP Preferred Stock
F-58