Columbia Sportswear 2002 Annual Report Download - page 21
Download and view the complete annual report
Please find page 21 of the 2002 Columbia Sportswear annual report below. You can navigate through the pages in the report by either clicking on the pages listed below, or by using the keyword search tool below to find specific information within the annual report.
Item 7. MANAGEMENT’S DISCUSSION AND ANALYSIS OF FINANCIAL CONDITION AND
RESULTS OF OPERATIONS
All references to years relate to the fiscal year ended December 31 of such year.
Results of Operations
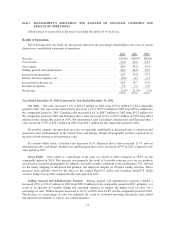
The following table sets forth, for the periods indicated, the percentage relationship to net sales of certain
items in our consolidated statements of operations:
2002 2001 2000
Net sales .......................................................... 100.0% 100.0% 100.0%
Cost of sales ....................................................... 53.6 54.2 54.4
Grossprofit........................................................ 46.4 45.8 45.6
Selling, general and administrative ..................................... 26.3 26.8 29.9
Income from operations .............................................. 20.1 19.0 15.7
Interest (income) expense, net ......................................... (0.0) 0.3 0.7
Incomebeforeincometax ............................................ 20.1 18.7 15.0
Incometaxexpense ................................................. 7.5 7.3 5.5
Netincome ........................................................ 12.6% 11.4% 9.5%
Year Ended December 31, 2002 Compared to Year Ended December 31, 2001
Net Sales: Net sales increased 4.7% to $816.3 million in 2002 from $779.6 million for the comparable
period in 2001. Net sales in the United States increased 1.1% to $557.5 million in 2002 from $551.2 million for
the comparable period in 2001. Canadian sales increased 6.6% to $86.7 million in 2002 from $81.3 million for
the comparable period in 2001 and European direct sales increased 16.5% to $95.9 million in 2002 from $82.3
million for the comparable period in 2001. Net international sales, excluding Canadian sales and European direct
sales, increased 17.8% to $76.2 million in 2002 from $64.7 million for the comparable period in 2001.
By product category, the growth in net sales was primarily attributable to increased sales of outerwear and
sportswear units predominantly in the United States and Europe, though all geographic markets experienced an
increase in both outerwear and sportswear sales.
In constant dollar terms, Canadian sales increased 8.1%, European direct sales increased 12.4% and net
international sales, excluding Canadian sales and European direct sales, increased 18.9% in 2002 compared to the
same period in 2001.
Gross Profit:Gross profit as a percentage of net sales was 46.4% in 2002 compared to 45.8% for the
comparable period in 2001. This increase was primarily the result of favorable sourcing costs for our products
and effective inventory management. In addition, favorable weather conditions in the northeastern U.S. allowed
for the timely shipping of full-priced fall products and improved margins on off-price selling activities. These
increases were partially offset by the effect of the weaker Euro/U.S. dollar and Canadian dollar/U.S. dollar
currency hedge rates in 2002 compared to the same period in 2001.
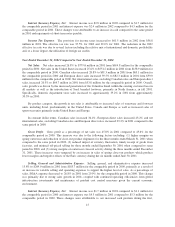
Selling, General and Administrative Expense: Selling, general, and administrative expense (“SG&A”)
increased 2.8% to $214.9 million in 2002 from $209.0 million for the comparable period in 2001, primarily as a
result of an increase in variable selling and operating expenses to support the higher level of sales. As a
percentage of sales, SG&A expense decreased to 26.3% in 2002 from 26.8% for the comparable period in 2001.
The decrease as a percentage of sales was primarily the result of continued operating efficiencies from global
infrastructure investments as well as cost control measures.
14


