Cigna 2014 Annual Report Download - page 89
Download and view the complete annual report
Please find page 89 of the 2014 Cigna annual report below. You can navigate through the pages in the report by either clicking on the pages listed below, or by using the keyword search tool below to find specific information within the annual report.-
 1
1 -
2
-
3
-
4
-
5
-
6
-
7
-
8
-
9
-
10
-
11
-
12
-
13
-
14
-
15
-
16
-
17
-
18
-
19
-
20
-
21
-
22
-
23
-
24
-
25
-
26
-
27
-
28
-
29
-
30
-
31
-
32
-
33
-
34
-
35
-
36
-
37
-
38
-
39
-
40
-
41
-
42
-
43
-
44
-
45
-
46
-
47
-
48
-
49
-
50
-
51
-
52
-
53
-
54
-
55
-
56
-
57
-
58
-
59
-
60
-
61
-
62
-
63
-
64
-
65
-
66
-
67
-
68
-
69
-
70
-
71
-
72
-
73
-
74
-
75
-
76
-
77
-
78
-
 79
79 -
 80
80 -
 81
81 -
 82
82 -
 83
83 -
 84
84 -
 85
85 -
 86
86 -
 87
87 -
 88
88 -
 89
89 -
 90
90 -
 91
91 -
 92
92 -
 93
93 -
 94
94 -
 95
95 -
 96
96 -
 97
97 -
 98
98 -
 99
99 -
100
-
101
-
102
-
103
-
104
-
105
-
106
-
107
-
108
-
109
-
110
-
111
-
112
-
113
-
114
-
115
-
116
-
117
-
118
-
119
-
120
-
121
-
122
-
123
-
124
-
125
-
126
-
127
-
128
-
129
-
130
-
131
-
132
-
133
-
134
-
135
-
136
-
137
-
138
-
139
-
140
-
141
-
142
-
143
-
144
-
145
-
146
-
147
-
148
-
149
-
150
-
151
-
152
-
153
-
154
-
155
-
156
-
157
-
158
-
159
-
160
-
161
-
162
-
163
-
164
-
165
-
166
-
167
-
168
-
169
-
170
-
171
-
172
-
173
-
174
-
175
-
176
-
177
-
178
-
179
-
180
-
181
-
182
 |
 |

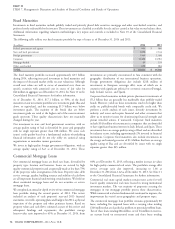
PART II
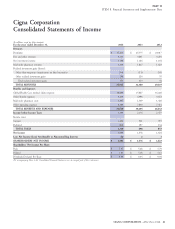
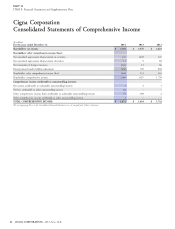
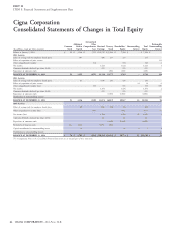
ITEM 7. Management’s Discussion and Analysis of Financial Condition and Results of Operations
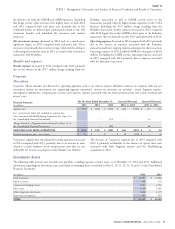
$80 million, net of $8 million in reserves, are current. All of the material effect on our results of operations, financial condition or
remaining loans continue to perform under their contractual terms. liquidity. See Note 11 to the Consolidated Financial Statements for
We have $247 million of loans maturing in the next twelve months. further information regarding Other Long-term Investments.
Given the quality and diversity of the underlying real estate, positive
debt service coverage and significant borrower cash investment
Problem and Potential Problem Investments
averaging 30%, we remain confident that the vast majority of ‘‘Problem’’ bonds and commercial mortgage loans are either
borrowers will continue to perform as expected under the contract delinquent by 60 days or more or have been restructured as to terms,
terms. including concessions by us for modification of interest rate, principal
payment or maturity date. ‘‘Potential problem’’ bonds and commercial
Other Long-term Investments
mortgage loans are considered current (no payment more than
Other long-term investments of $1.5 billion primarily include 59 days past due), but management believes they have certain
investments in security partnership and real estate funds as well as characteristics that increase the likelihood that they may become
direct investments in real estate joint ventures. The funds typically problems. The characteristics management considers include, but are
invest in mezzanine debt or equity of privately held companies not limited to, the following:
(securities partnerships) and equity real estate. Given our subordinate request from the borrower for restructuring;
position in the capital structure of these underlying entities, we
principal or interest payments past due by more than 30 but fewer
assume a higher level of risk for higher expected returns. To mitigate
risk, investments are diversified across approximately 110 separate than 60 days;
partnerships, and approximately 65 general partners who manage one downgrade in credit rating;
or more of these partnerships. Also, the funds’ underlying investments collateral losses on asset-backed securities; and
are diversified by industry sector or property type, and geographic for commercial mortgages, deterioration of debt service coverage
region. No single partnership investment exceeds 6% of our securities below 1.0 or value declines resulting in estimated loan-to-value
and real estate partnership portfolio. ratios increasing to 100% or more.
Although the total fair values of investments exceeded their carrying
We recognize interest income on problem bonds and commercial
values as of December 31, 2014, the fair value of our ownership
mortgage loans only when payment is actually received because of the
interest in certain funds that are carried at cost was less than carrying
risk profile of the underlying investment. The amount that would
value by $17 million. We expect to recover our carrying value over the
have been reflected in net income if interest on non-accrual
average remaining life of these investments of approximately 5 years.
investments had been recognized in accordance with the original
Given the current economic environment, future impairments are
possible; however, management does not expect those losses to have a terms was not significant for 2014 or 2013.
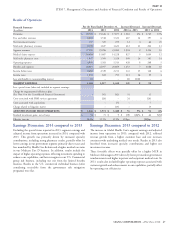
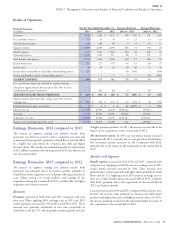
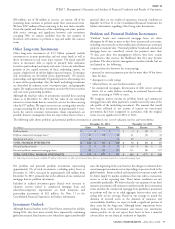
The following table shows problem and potential problem investments at amortized cost, net of valuation reserves and write-downs:
December 31, 2014 December 31, 2013
(In millions)
Gross Reserve Net Gross Reserve Net
Problem bonds $ – $ – $ – $ 2 $ (2) $ –
Problem commercial mortgage loans
(1)
90 (4) 86 41 (3) 38
Foreclosed real estate 24 – 24 29 – 29
TOTAL PROBLEM INVESTMENTS $ 114 $ (4) $ 110 $ 72 $ (5) $ 67
Potential problem bonds $ 22 $ (9) $ 13 $ 30 $ (9) $ 21
Potential problem commercial mortgage loans 130 (8) 122 135 (8) 127
TOTAL POTENTIAL PROBLEM INVESTMENTS $ 152 $ (17) $ 135 $ 165 $ (17) $ 148
(1) Other long-term investments included $7 million at December 31, 2013 of restructured loans that were previously reported in commercial mortgage loans.
Net problem and potential problem investments representing since the beginning of the year, however the changes in valuation have
varied amongst investment sectors depending on perceived risk in the
approximately 1% of total investments, excluding policy loans at
global markets. Future realized and unrealized investment results will
December 31, 2014, increased by approximately $30 million from
be driven largely by market conditions that exist when a transaction
December 31, 2013, primarily due to the addition of one commercial
occurs or at the reporting date. These future conditions are not
mortgage loan to problem investments.
reasonably predictable. We believe that the vast majority of our fixed
Included in realized investment gains (losses) were increases in maturity investments will continue to perform under their contractual
valuation reserves related to commercial mortgage loans and terms and that the commercial mortgage loan portfolio is positioned
other-than-temporary impairments on fixed maturities and to perform well due to its solid aggregate loan-to-value ratio and
partnership investments of $52 million. See Note 11 to the strong debt service coverage. Based on our strategy to match the
Consolidated Financial Statements for further information. duration of invested assets to the duration of insurance and
contractholder liabilities, we expect to hold a significant portion of
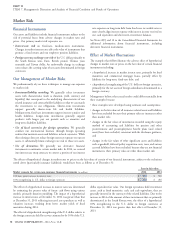
Investment Outlook
these assets for the long term. Although future impairment losses
Although financial markets in the United States continued to stabilize resulting from credit deterioration and interest rate movements
during 2014, they have more recently been impacted by continuing remain possible, we do not expect these losses to have a material
global uncertainty. Fixed income asset values have appreciated broadly adverse effect on our financial condition or liquidity.
CIGNA CORPORATION - 2014 Form 10-K 57
•
•
•
•
•