Cigna 2014 Annual Report Download - page 86
Download and view the complete annual report
Please find page 86 of the 2014 Cigna annual report below. You can navigate through the pages in the report by either clicking on the pages listed below, or by using the keyword search tool below to find specific information within the annual report.-
 1
1 -
2
-
3
-
4
-
5
-
6
-
7
-
8
-
9
-
10
-
11
-
12
-
13
-
14
-
15
-
16
-
17
-
18
-
19
-
20
-
21
-
22
-
23
-
24
-
25
-
26
-
27
-
28
-
29
-
30
-
31
-
32
-
33
-
34
-
35
-
36
-
37
-
38
-
39
-
40
-
41
-
42
-
43
-
44
-
45
-
46
-
47
-
48
-
49
-
50
-
51
-
52
-
53
-
54
-
55
-
56
-
57
-
58
-
59
-
60
-
61
-
62
-
63
-
64
-
65
-
66
-
67
-
68
-
69
-
70
-
71
-
72
-
73
-
74
-
75
-
 76
76 -
 77
77 -
 78
78 -
 79
79 -
 80
80 -
 81
81 -
 82
82 -
 83
83 -
 84
84 -
 85
85 -
 86
86 -
 87
87 -
 88
88 -
 89
89 -
 90
90 -
 91
91 -
 92
92 -
 93
93 -
 94
94 -
 95
95 -
 96
96 -
97
-
98
-
99
-
100
-
101
-
102
-
103
-
104
-
105
-
106
-
107
-
108
-
109
-
110
-
111
-
112
-
113
-
114
-
115
-
116
-
117
-
118
-
119
-
120
-
121
-
122
-
123
-
124
-
125
-
126
-
127
-
128
-
129
-
130
-
131
-
132
-
133
-
134
-
135
-
136
-
137
-
138
-
139
-
140
-
141
-
142
-
143
-
144
-
145
-
146
-
147
-
148
-
149
-
150
-
151
-
152
-
153
-
154
-
155
-
156
-
157
-
158
-
159
-
160
-
161
-
162
-
163
-
164
-
165
-
166
-
167
-
168
-
169
-
170
-
171
-
172
-
173
-
174
-
175
-
176
-
177
-
178
-
179
-
180
-
181
-
182
 |
 |

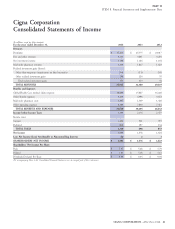
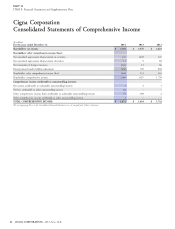
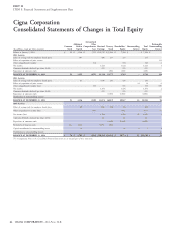
PART II
ITEM 7. Management’s Discussion and Analysis of Financial Condition and Results of Operations
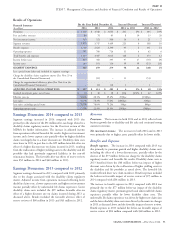
Operating expense ratio. The decrease in the operating expense ratio in both 2014 and 2013 reflected continued expense discipline.
Effective tax rate. The segment’s effective tax rate is generally lower than the federal tax rate of 35%, primarily due to tax-exempt interest
income on bonds. The increase in the effective tax rate in 2014 compared with 2013 resulted from a decline in the proportion of the segment’s
income that was attributable to tax-exempt interest and, to a lesser extent, the absence of the tax benefit reported in 2013 related to the
completion of IRS tax audits. The decline in the effective tax rate in 2013 compared with 2012 was due to the tax benefit reported in 2013 related
to the completion of IRS tax audits.
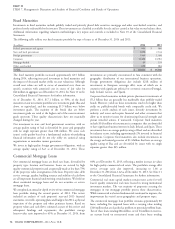
Other Operations
Description
Cigna’s COLI business contributes the majority of earnings in Other Operations. In the first quarter of 2014, we combined the results of the
Run-off Reinsurance segment with other immaterial segments in Other Operations, because the results are expected to be immaterial subsequent
to the reinsurance transaction with Berkshire in 2013. Cigna’s Other Operations segment also includes the results from the run-off settlement
annuity business, as well as the remaining deferred gains recognized from the sale of the individual life insurance and annuity and retirement
benefits businesses. Prior year information has been conformed to the current year presentation.
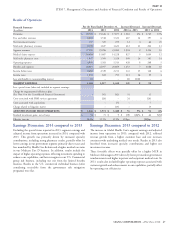
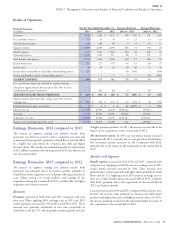
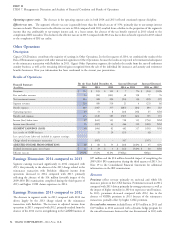
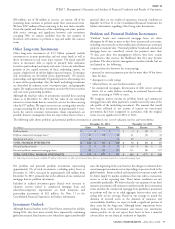
Results of Operations
For the Years Ended December 31, Increase/(Decrease) Increase/(Decrease)
Financial Summary
2014 2013 2012 2014 vs. 2013 2013 vs. 2012
(In millions)
Premiums $ 112 $ 105 $ 121 $ 7 7% $ (16) (13)%
Fees and other revenues 14 (24) (101) 38 158 77 76
Net investment income 384 408 490 (24) (6) (82) (17)
Segment revenues 510 489 510 21 4 (21) (4)
Benefit expenses 380 1,067 377 (687) (64) 690 183
Operating expenses 33 53 8 (20) (38) 45 N/M
Benefits and expenses 413 1,120 385 (707) (63) 735 191
Income (loss) before taxes 97 (631) 125 728 115 (756) N/M
Income taxes (benefits) 29 (237) 43 266 112 (280) N/M
SEGMENT EARNINGS (LOSS) 68 (394) 82 462 117 (476) N/M
Less: results of GMIB business – 25 29 (25) (4)
Less: special items (after-tax) included in segment earnings:
Charge related to reinsurance transaction – (507) – 507 (507)
ADJUSTED INCOME FROM OPERATIONS $ 68 $ 88 $ 53 $ (20) (23)% $ 35 66%
Realized investment gains, net of taxes $ 11 $ 23 $ 3 $ (12) (52)% $ 20 N/M
Effective tax rate 29.9% 37.6% 34.4% (770)bps 320bps
$27 million and the $14 million favorable impact of completing the
Earnings Discussion: 2014 compared to 2013
2009-2010 IRS examinations during the third quarter of 2013. See
Segment earnings increased significantly in 2014 compared with Note 19 to the Consolidated Financial Statements for additional
2013, due primarily to the absence of the 2013 charge related to the information on the IRS examinations.
reinsurance transaction with Berkshire. Adjusted income from
operations decreased in 2014 compared with 2013, primarily
Revenues
reflecting the absence of the $14 million favorable impact of the Premiums reflect revenue primarily on universal and whole life
2009-2010 IRS examinations completed during the third quarter of insurance policies in the COLI business. Premiums increased in 2014
2013 and higher COLI claims experience in 2014. compared with 2013 driven primarily by strong persistency as well as
the impact of higher mortality in 2014 on experience-rated business.
Earnings Discussion: 2013 compared to 2012
In 2013, premiums decreased compared with 2012, due to the
absence of VADBe premium in 2013 because of the reinsurance
The decrease in segment results in 2013 compared with 2012 was transaction, partially offset by higher COLI premium.
driven largely by the 2013 charge related to the reinsurance
transaction with Berkshire. The increase in adjusted income from Fees and other revenues included losses of $39 million in 2013 and
operations in 2013, compared with 2012, primarily resulted from the $119 million in 2012 associated with a dynamic hedge program for
absence of the 2012 reserve strengthening in the GMDB business of the run-off reinsurance business that was discontinued in 2013 with
54 CIGNA CORPORATION - 2014 Form 10-K