Cigna 2014 Annual Report Download - page 126
Download and view the complete annual report
Please find page 126 of the 2014 Cigna annual report below. You can navigate through the pages in the report by either clicking on the pages listed below, or by using the keyword search tool below to find specific information within the annual report.-
 1
1 -
2
-
3
-
4
-
5
-
6
-
7
-
8
-
9
-
10
-
11
-
12
-
13
-
14
-
15
-
16
-
17
-
18
-
19
-
20
-
21
-
22
-
23
-
24
-
25
-
26
-
27
-
28
-
29
-
30
-
31
-
32
-
33
-
34
-
35
-
36
-
37
-
38
-
39
-
40
-
41
-
42
-
43
-
44
-
45
-
46
-
47
-
48
-
49
-
50
-
51
-
52
-
53
-
54
-
55
-
56
-
57
-
58
-
59
-
60
-
61
-
62
-
63
-
64
-
65
-
66
-
67
-
68
-
69
-
70
-
71
-
72
-
73
-
74
-
75
-
76
-
77
-
78
-
79
-
80
-
81
-
82
-
83
-
84
-
85
-
86
-
87
-
88
-
89
-
90
-
91
-
92
-
93
-
94
-
95
-
96
-
97
-
98
-
99
-
100
-
101
-
102
-
103
-
104
-
105
-
106
-
107
-
108
-
109
-
110
-
111
-
112
-
113
-
114
-
115
-
 116
116 -
 117
117 -
 118
118 -
 119
119 -
 120
120 -
 121
121 -
 122
122 -
 123
123 -
 124
124 -
 125
125 -
 126
126 -
 127
127 -
 128
128 -
 129
129 -
 130
130 -
 131
131 -
 132
132 -
 133
133 -
 134
134 -
 135
135 -
 136
136 -
137
-
138
-
139
-
140
-
141
-
142
-
143
-
144
-
145
-
146
-
147
-
148
-
149
-
150
-
151
-
152
-
153
-
154
-
155
-
156
-
157
-
158
-
159
-
160
-
161
-
162
-
163
-
164
-
165
-
166
-
167
-
168
-
169
-
170
-
171
-
172
-
173
-
174
-
175
-
176
-
177
-
178
-
179
-
180
-
181
-
182
 |
 |

PART II
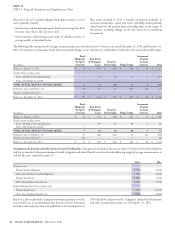
ITEM 8. Financial Statements and Supplementary Data
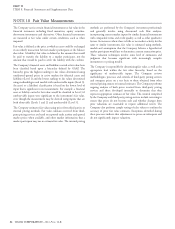
and remaining maturities. These measurements were classified in Fair values of off-balance-sheet financial instruments were not
Level 2 because the fair values are based on quoted market prices or material as of December 31, 2014 and 2013.
other inputs that are market observable or can be corroborated by
market data.
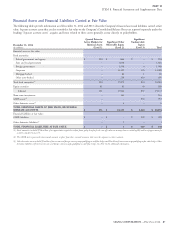
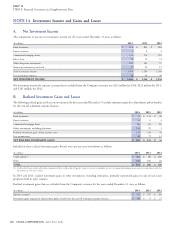
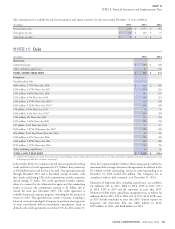
Investments
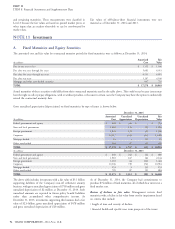
A. Fixed Maturities and Equity Securities
The amortized cost and fair value by contractual maturity periods for fixed maturities were as follows at December 31, 2014:
Amortized Fair
(In millions)
Cost Value
Due in one year or less $ 1,152 $ 1,166
Due after one year through five years 5,681 6,051
Due after five years through ten years 6,531 6,891
Due after ten years 3,267 4,140
Mortgage and other asset-backed securities 647 735
TOTAL $ 17,278 $ 18,983
Actual maturities of these securities could differ from their contractual maturities used in the table above. This could occur because issuers may
have the right to call or prepay obligations, with or without penalties, or because in certain cases the Company may have the option to unilaterally
extend the contractual maturity date.
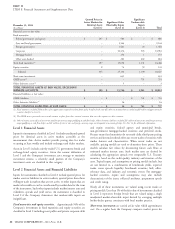
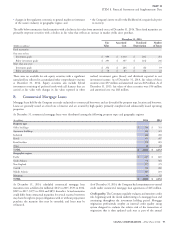
Gross unrealized appreciation (depreciation) on fixed maturities by type of issuer is shown below.
December 31, 2014
Amortized Unrealized Unrealized Fair
(In millions)
Cost Appreciation Depreciation Value
Federal government and agency $ 608 $ 346 $ – $ 954
State and local government 1,682 176 (2) 1,856
Foreign government 1,824 121 (5) 1,940
Corporate 12,517 1,014 (33) 13,498
Mortgage-backed 83 3 (1) 85
Other asset-backed 564 87 (1) 650
TOTAL $ 17,278 $ 1,747 $ (42) $ 18,983
(In millions)
December 31, 2013
Federal government and agency $ 640 $ 242 $ (2) $ 880
State and local government 1,983 167 (6) 2,144
Foreign government 1,392 64 (12) 1,444
Corporate 10,306 749 (74) 10,981
Mortgage-backed 153 3 (3) 153
Other asset-backed 799 87 (2) 884
TOTAL $ 15,273 $ 1,312 $ (99) $ 16,486
The above table includes investments with a fair value of $3.1 billion As of December 31, 2014, the Company had commitments to
supporting liabilities of the Company’s run-off settlement annuity purchase $74 million of fixed maturities, all of which bear interest at a
business, with gross unrealized appreciation of $758 million and gross fixed market rate.
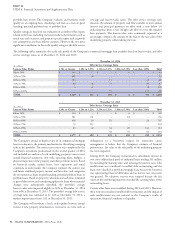
unrealized depreciation of $2 million at December 31, 2014. Such Review of declines in fair value. Management reviews fixed
unrealized amounts are reported in future policy benefit liabilities maturities with a decline in fair value from cost for impairment based
rather than accumulated other comprehensive income. At on criteria that include:
December 31, 2013, investments supporting this business had a fair
value of $2.6 billion, gross unrealized appreciation of $478 million length of time and severity of decline;
and gross unrealized depreciation of $20 million. financial health and specific near term prospects of the issuer;
94 CIGNA CORPORATION - 2014 Form 10-K
NOTE 11
•
•