Cigna 2014 Annual Report Download - page 106
Download and view the complete annual report
Please find page 106 of the 2014 Cigna annual report below. You can navigate through the pages in the report by either clicking on the pages listed below, or by using the keyword search tool below to find specific information within the annual report.-
 1
1 -
2
-
3
-
4
-
5
-
6
-
7
-
8
-
9
-
10
-
11
-
12
-
13
-
14
-
15
-
16
-
17
-
18
-
19
-
20
-
21
-
22
-
23
-
24
-
25
-
26
-
27
-
28
-
29
-
30
-
31
-
32
-
33
-
34
-
35
-
36
-
37
-
38
-
39
-
40
-
41
-
42
-
43
-
44
-
45
-
46
-
47
-
48
-
49
-
50
-
51
-
52
-
53
-
54
-
55
-
56
-
57
-
58
-
59
-
60
-
61
-
62
-
63
-
64
-
65
-
66
-
67
-
68
-
69
-
70
-
71
-
72
-
73
-
74
-
75
-
76
-
77
-
78
-
79
-
80
-
81
-
82
-
83
-
84
-
85
-
86
-
87
-
88
-
89
-
90
-
91
-
92
-
93
-
94
-
95
-
 96
96 -
 97
97 -
 98
98 -
 99
99 -
 100
100 -
 101
101 -
 102
102 -
 103
103 -
 104
104 -
 105
105 -
 106
106 -
 107
107 -
 108
108 -
 109
109 -
 110
110 -
 111
111 -
 112
112 -
 113
113 -
 114
114 -
 115
115 -
 116
116 -
117
-
118
-
119
-
120
-
121
-
122
-
123
-
124
-
125
-
126
-
127
-
128
-
129
-
130
-
131
-
132
-
133
-
134
-
135
-
136
-
137
-
138
-
139
-
140
-
141
-
142
-
143
-
144
-
145
-
146
-
147
-
148
-
149
-
150
-
151
-
152
-
153
-
154
-
155
-
156
-
157
-
158
-
159
-
160
-
161
-
162
-
163
-
164
-
165
-
166
-
167
-
168
-
169
-
170
-
171
-
172
-
173
-
174
-
175
-
176
-
177
-
178
-
179
-
180
-
181
-
182
 |
 |

PART II
ITEM 8. Financial Statements and Supplementary Data
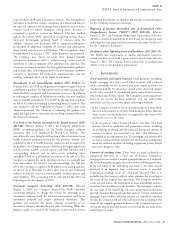
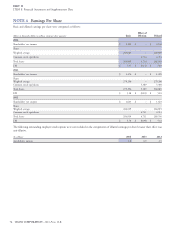
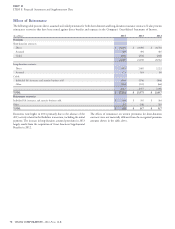
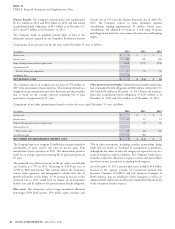
Earnings Per Share
Basic and diluted earnings per share were computed as follows:
Effect of
(Shares in thousands, dollars in millions, except per share amounts)
Basic Dilution Diluted
2014
Shareholders’ net income $ 2,102 $ – $ 2,102
Shares
Weighted average 263,889 – 263,889
Common stock equivalents 4,714 4,714
Total shares 263,889 4,714 268,603
EPS $ 7.97 $ (0.14) $ 7.83
2013
Shareholders’ net income $ 1,476 $ – $ 1,476
Shares
Weighted average 279,296 – 279,296
Common stock equivalents 5,389 5,389
Total shares 279,296 5,389 284,685
EPS $ 5.28 $ (0.10) $ 5.18
2012
Shareholders’ net income $ 1,623 $ – $ 1,623
Shares
Weighted average 284,819 – 284,819
Common stock equivalents 4,711 4,711
Total shares 284,819 4,711 289,530
EPS $ 5.70 $ (0.09) $ 5.61
The following outstanding employee stock options were not included in the computation of diluted earnings per share because their effect was
anti-dilutive.
(In millions)
2014 2013 2012
Anti-dilutive options 1.0 0.9 2.5
74 CIGNA CORPORATION - 2014 Form 10-K
NOTE 4