Cigna 2014 Annual Report Download - page 87
Download and view the complete annual report
Please find page 87 of the 2014 Cigna annual report below. You can navigate through the pages in the report by either clicking on the pages listed below, or by using the keyword search tool below to find specific information within the annual report.-
 1
1 -
2
-
3
-
4
-
5
-
6
-
7
-
8
-
9
-
10
-
11
-
12
-
13
-
14
-
15
-
16
-
17
-
18
-
19
-
20
-
21
-
22
-
23
-
24
-
25
-
26
-
27
-
28
-
29
-
30
-
31
-
32
-
33
-
34
-
35
-
36
-
37
-
38
-
39
-
40
-
41
-
42
-
43
-
44
-
45
-
46
-
47
-
48
-
49
-
50
-
51
-
52
-
53
-
54
-
55
-
56
-
57
-
58
-
59
-
60
-
61
-
62
-
63
-
64
-
65
-
66
-
67
-
68
-
69
-
70
-
71
-
72
-
73
-
74
-
75
-
76
-
 77
77 -
 78
78 -
 79
79 -
 80
80 -
 81
81 -
 82
82 -
 83
83 -
 84
84 -
 85
85 -
 86
86 -
 87
87 -
 88
88 -
 89
89 -
 90
90 -
 91
91 -
 92
92 -
 93
93 -
 94
94 -
 95
95 -
 96
96 -
 97
97 -
98
-
99
-
100
-
101
-
102
-
103
-
104
-
105
-
106
-
107
-
108
-
109
-
110
-
111
-
112
-
113
-
114
-
115
-
116
-
117
-
118
-
119
-
120
-
121
-
122
-
123
-
124
-
125
-
126
-
127
-
128
-
129
-
130
-
131
-
132
-
133
-
134
-
135
-
136
-
137
-
138
-
139
-
140
-
141
-
142
-
143
-
144
-
145
-
146
-
147
-
148
-
149
-
150
-
151
-
152
-
153
-
154
-
155
-
156
-
157
-
158
-
159
-
160
-
161
-
162
-
163
-
164
-
165
-
166
-
167
-
168
-
169
-
170
-
171
-
172
-
173
-
174
-
175
-
176
-
177
-
178
-
179
-
180
-
181
-
182
 |
 |

PART II
ITEM 7. Management’s Discussion and Analysis of Financial Condition and Results of Operations
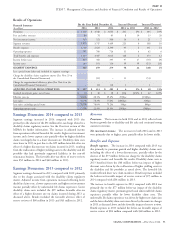
the effective exit from the GMDB and GMIB businesses. Excluding Berkshire transaction as well as GMDB activity prior to the
this hedge activity, other revenues were slightly lower in both 2014 transaction, partially offset by higher claims experience in the COLI
and 2013 compared with each prior year, primarily due to the business. Excluding the $727 million charge resulting from the
continued decline in deferred gain amortization related to the sold Berkshire transaction, benefit expenses decreased in 2013 compared
retirement benefits and individual life insurance and annuity with 2012 largely due to the GMDB activity prior to the Berkshire
businesses. transaction, that was favorable in early 2013 and unfavorable in 2012.
Net investment income decreased in 2014 and, to a much more Operating expenses decreased in 2014 compared with 2013 primarily
significant degree, in 2013 compared with each prior year. These due to the absence of expenses associated with the Berkshire
decreases were primarily due to lower average yields and the selling or transaction and lower ongoing expenses subsequent to the transaction.
reallocating of investment assets in 2013 as a result of the reinsurance Operating expenses in 2012 included GMIB fair value gains of $(41)
transaction with Berkshire. million. Excluding this GMIB activity, operating expenses increased
in 2013 compared with 2012 primarily due to expenses associated
Benefits and expenses
with the Berkshire transaction.
Benefit expenses decreased in 2014 compared with 2013 primarily
due to the absence of the $727 million charge resulting from the
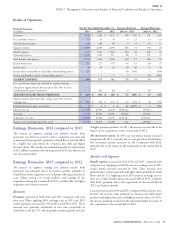
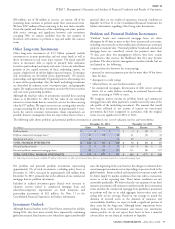
Corporate
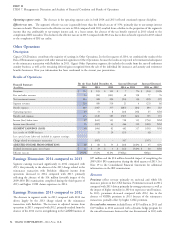
Description
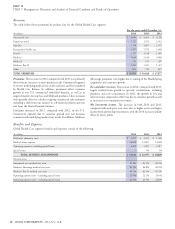
Corporate reflects amounts not allocated to operating segments, such as net interest expense (defined as interest on corporate debt less net
investment income on investments not supporting segment operations), interest on uncertain tax positions, certain litigation matters,
intersegment eliminations, compensation cost for stock options, expense associated with our frozen pension plans and certain overhead and
project costs.
For the Years Ended December 31, Increase/(Decrease) Increase/(Decrease)
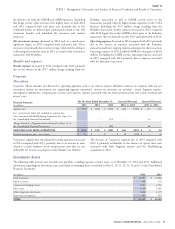
Financial Summary
2014 2013 2012 2014 vs. 2013 2013 vs. 2012
(In millions)
Segment loss $ (265) $ (222) $ (329) $ (43) (19)% $ 107 33%
Less: special items (after-tax) included in segment loss:
Cost associated with HealthSpring acquisition (See Note 3 to
the Consolidated Financial Statements) – – (33) – 33
Charge related to a litigation matter discussed in Note 23 to
the Consolidated Financial Statements – – (68) – 68
ADJUSTED LOSS FROM OPERATIONS $ (265) $ (222) $ (228) $ (43) (19)% $ 6 3%
Realized investment gains, net of taxes $ 24 $ – $ – $ 24 N/M $ – –%
Corporate’s segment loss and adjusted loss from operations increased The decrease in Corporate’s segment loss in 2013 compared with
in 2014 compared with 2013, primarily due to an increase in taxes 2012 is primarily attributable to the absence of special item costs
related to certain employee stock compensation costs that are not associated with both litigation matters and the HealthSpring
deductible for income tax purposes under Health Care Reform. acquisition in 2012.
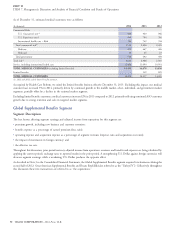
Investment Assets
The following table presents our invested asset portfolio, excluding separate account assets, as of December 31, 2014 and 2013. Additional
information regarding our investment assets and related accounting policies is included in Notes 2, 10, 11, 12, 13, 14 and 17 to the Consolidated
Financial Statements.
(In millions)
2014 2013
Fixed maturities $ 18,983 $ 16,486
Equity securities 189 141
Commercial mortgage loans 2,081 2,252
Policy loans 1,438 1,485
Other long-term investments 1,488 1,370
Short-term investments 163 631
TOTAL $ 24,342 $ 22,365
CIGNA CORPORATION - 2014 Form 10-K 55