Barclays 2008 Annual Report Download - page 8
Download and view the complete annual report
Please find page 8 of the 2008 Barclays annual report below. You can navigate through the pages in the report by either clicking on the pages listed below, or by using the keyword search tool below to find specific information within the annual report.-
 1
1 -
 2
2 -
 3
3 -
 4
4 -
 5
5 -
 6
6 -
 7
7 -
 8
8 -
 9
9 -
 10
10 -
 11
11 -
 12
12 -
 13
13 -
 14
14 -
 15
15 -
 16
16 -
 17
17 -
 18
18 -
 19
19 -
20
-
21
-
22
-
23
-
24
-
25
-
26
-
27
-
28
-
29
-
30
-
31
-
32
-
33
-
34
-
35
-
36
-
37
-
38
-
39
-
40
-
41
-
42
-
43
-
44
-
45
-
46
-
47
-
48
-
49
-
50
-
51
-
52
-
53
-
54
-
55
-
56
-
57
-
58
-
59
-
60
-
61
-
62
-
63
-
64
-
65
-
66
-
67
-
68
-
69
-
70
-
71
-
72
-
73
-
74
-
75
-
76
-
77
-
78
-
79
-
80
-
81
-
82
-
83
-
84
-
85
-
86
-
87
-
88
-
89
-
90
-
91
-
92
-
93
-
94
-
95
-
96
-
97
-
98
-
99
-
100
-
101
-
102
-
103
-
104
-
105
-
106
-
107
-
108
-
109
-
110
-
111
-
112
-
113
-
114
-
115
-
116
-
117
-
118
-
119
-
120
-
121
-
122
-
123
-
124
-
125
-
126
-
127
-
128
-
129
-
130
-
131
-
132
-
133
-
134
-
135
-
136
-
137
-
138
-
139
-
140
-
141
-
142
-
143
-
144
-
145
-
146
-
147
-
148
-
149
-
150
-
151
-
152
-
153
-
154
-
155
-
156
-
157
-
158
-
159
-
160
-
161
-
162
-
163
-
164
-
165
-
166
-
167
-
168
-
169
-
170
-
171
-
172
-
173
-
174
-
175
-
176
-
177
-
178
-
179
-
180
-
181
-
182
-
183
-
184
-
185
-
186
-
187
-
188
-
189
-
190
-
191
-
192
-
193
-
194
-
195
-
196
-
197
-
198
-
199
-
200
-
201
-
202
-
203
-
204
-
205
-
206
-
207
-
208
-
209
-
210
-
211
-
212
-
213
-
214
-
215
-
216
-
217
-
218
-
219
-
220
-
221
-
222
-
223
-
224
-
225
-
226
-
227
-
228
-
229
-
230
-
231
-
232
-
233
-
234
-
235
-
236
-
237
-
238
-
239
-
240
-
241
-
242
-
243
-
244
-
245
-
246
-
247
-
248
-
249
-
250
-
251
-
252
-
253
-
254
-
255
-
256
-
257
-
258
-
259
-
260
-
261
-
262
-
263
-
264
-
265
-
266
-
267
-
268
-
269
-
270
-
271
-
272
-
273
-
274
-
275
-
276
-
277
-
278
-
279
-
280
-
281
-
282
-
283
-
284
-
285
-
286
-
287
-
288
-
289
-
290
-
291
-
292
-
293
-
294
-
295
-
296
-
297
-
298
-
299
-
300
-
301
-
302
-
303
-
304
-
305
-
306
-
307
-
308
-
309
-
310
-
311
-
312
-
313
-
314
-
315
-
316
-
317
-
318
-
319
-
320
-
321
-
322
-
323
-
324
-
325
-
326
-
327
-
328
-
329
-
330
 |
 |

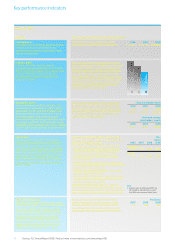
Key performance indicators
Financial KPIs
Economic profit
Economic Profit (EP) is the other primary
profitability measure used by Barclays. EP is profit
after tax and minority interests less a capital charge
(average shareholders’ equity and goodwill
excluding minority interests multiplied by the
Group cost of capital).
Barclays believes that economic profit encourages
both profitable growth and the efficient use of capital.
Barclays has a set of four year performance goalsfor
the period 2008 to 2011 inclusive. The primary goal is
to achieve compound annual growth in economic
profit in the range of 5% to 10% (£9.3bn to £10.6bn
of cumulative economic profit) over the 2008 to 2011
goal period. Given the increase in the cost of capital
and regulatory capital requirements in 2008 we
intend to publish new goals in 2009.
These measures indicate the returns shareholders
are receiving for their investment in Barclays both
in terms of relative share price movements and the
business performance. These metrics demonstrate
the alignment of Barclays strategy and operations
with the interests of shareholders.
Profit before tax is a key indicator of financial
performance to the majority of our stakeholders.
Shareholder returns
Total shareholder return (TSR) is defined as the
value created for shareholders through share price
appreciation, plus reinvested dividend payments.
We compare Barclays performance with a group
of international peers and aim for top quartile
performance. Return on average shareholders’ equity
is calculated as profit after tax divided by the average
shareholders’ equity during the year, which is made up
of share capital, retained earnings and other reserves.
Profit before tax
Profit before tax is one of the two primary profitability
measures used to assess performance and
represents total income less impairment charges
and operating expenses.
£2,704m
£2,290m
£1,760m
06
07
08
Total shareholder return
2006 2007 2008
2nd 3rd 2nd
quartile quartile quartile
Return on average
shareholders’ equity
2006 2007 2008
24.7% 20.3% 16.5%
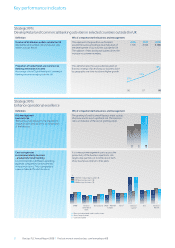
The Group’s capital management activities seek to
maximise shareholders’ value by optimising the level
and mix of its capital resources.
The Group’s capital management objectives are to:
– Maintain sufficient capital resources to meet the
minimum regulatory capital requirements set by
the UK FSA and the US Federal Reserve Bank’s
requirements that a financial holding company
be ‘well capitalised’
– Maintain sufficient capital resources to support the
Group’s Risk Appetite and economic capital requirements
– Support the Group’s credit rating
– Ensure locally regulated subsidiaries can meet their
minimum capital requirements
– Allocate capital to businesses to support the Group’s
strategic objectives, including optimising returns on
economic and regulatory capital.
We expect to maintain our Equity Tier 1 and Tier 1
ratios at levels which significantly exceed the current
minimum requirements of the UK FSA for the duration
of the current period of financial and economic stress.
Capital ratios
Capital requirements are part of the regulatory
framework governing how banks and depository
institutions are managed. Capital ratios express a
bank’s capital as a percentage of its risk weighted
assets. Tier 1 capital is defined by the UK FSA with
Equity Tier 1 broadly being tangible shareholders’
funds within Tier 1.The 2008 pro-forma ratios
reflect the conversion of Mandatorily Convertible
Notes and inclusion of all innovative instruments
in Tier 1 capital.
Why it’s important to the business and managementDefinition
Pro-
forma
2006 2007 2008 2008
Equity Tier 1a
5.3% 5.1% 5.8% 6.7%
Tier 1a
7.7% 7.6% 8.6% 9.7%
Note
aCapital ratios for 2008 and 2007 are
calculated on a Basel II basis, whilst
the 2006 ratios are on a Basel I basis
Barclays believes that there will be more capital
and less leverage in the banking system, as a key
measure of stability, which is consistent with the
views of regulators and investors. Barclays expects
adjusted gross leverage to reduce further over time.
Adjusted Gross Leverage
Adjusted gross leverage is defined as the multiple
of adjusted total tangible assets over total qualifying
Tier 1 capital. Adjusted total tangible assets are
total assets less derivative counterparty netting,
assets under management on the balance sheet,
settlement balances, goodwill and intangible
assets. Tier 1 capital is defined by the UK FSA.
The 2008 Pro forma ratio reflects the conversion
of Mandatorily Convertible Notes and inclusion
of all innovative instruments in Tier 1 capital.
Pro-forma
2007 2008 2008
33x 28x 24x
2006 2007 2008
£7,136m £7,076m £6,077m
6Barclays PLC Annual Report 2008 |Find out more at www.barclays.com/annualreport08