Barclays 2008 Annual Report Download - page 19
Download and view the complete annual report
Please find page 19 of the 2008 Barclays annual report below. You can navigate through the pages in the report by either clicking on the pages listed below, or by using the keyword search tool below to find specific information within the annual report.-
 1
1 -
2
-
3
-
4
-
5
-
6
-
7
-
8
-
 9
9 -
 10
10 -
 11
11 -
 12
12 -
 13
13 -
 14
14 -
 15
15 -
 16
16 -
 17
17 -
 18
18 -
 19
19 -
 20
20 -
 21
21 -
 22
22 -
 23
23 -
 24
24 -
 25
25 -
 26
26 -
 27
27 -
 28
28 -
 29
29 -
30
-
31
-
32
-
33
-
34
-
35
-
36
-
37
-
38
-
39
-
40
-
41
-
42
-
43
-
44
-
45
-
46
-
47
-
48
-
49
-
50
-
51
-
52
-
53
-
54
-
55
-
56
-
57
-
58
-
59
-
60
-
61
-
62
-
63
-
64
-
65
-
66
-
67
-
68
-
69
-
70
-
71
-
72
-
73
-
74
-
75
-
76
-
77
-
78
-
79
-
80
-
81
-
82
-
83
-
84
-
85
-
86
-
87
-
88
-
89
-
90
-
91
-
92
-
93
-
94
-
95
-
96
-
97
-
98
-
99
-
100
-
101
-
102
-
103
-
104
-
105
-
106
-
107
-
108
-
109
-
110
-
111
-
112
-
113
-
114
-
115
-
116
-
117
-
118
-
119
-
120
-
121
-
122
-
123
-
124
-
125
-
126
-
127
-
128
-
129
-
130
-
131
-
132
-
133
-
134
-
135
-
136
-
137
-
138
-
139
-
140
-
141
-
142
-
143
-
144
-
145
-
146
-
147
-
148
-
149
-
150
-
151
-
152
-
153
-
154
-
155
-
156
-
157
-
158
-
159
-
160
-
161
-
162
-
163
-
164
-
165
-
166
-
167
-
168
-
169
-
170
-
171
-
172
-
173
-
174
-
175
-
176
-
177
-
178
-
179
-
180
-
181
-
182
-
183
-
184
-
185
-
186
-
187
-
188
-
189
-
190
-
191
-
192
-
193
-
194
-
195
-
196
-
197
-
198
-
199
-
200
-
201
-
202
-
203
-
204
-
205
-
206
-
207
-
208
-
209
-
210
-
211
-
212
-
213
-
214
-
215
-
216
-
217
-
218
-
219
-
220
-
221
-
222
-
223
-
224
-
225
-
226
-
227
-
228
-
229
-
230
-
231
-
232
-
233
-
234
-
235
-
236
-
237
-
238
-
239
-
240
-
241
-
242
-
243
-
244
-
245
-
246
-
247
-
248
-
249
-
250
-
251
-
252
-
253
-
254
-
255
-
256
-
257
-
258
-
259
-
260
-
261
-
262
-
263
-
264
-
265
-
266
-
267
-
268
-
269
-
270
-
271
-
272
-
273
-
274
-
275
-
276
-
277
-
278
-
279
-
280
-
281
-
282
-
283
-
284
-
285
-
286
-
287
-
288
-
289
-
290
-
291
-
292
-
293
-
294
-
295
-
296
-
297
-
298
-
299
-
300
-
301
-
302
-
303
-
304
-
305
-
306
-
307
-
308
-
309
-
310
-
311
-
312
-
313
-
314
-
315
-
316
-
317
-
318
-
319
-
320
-
321
-
322
-
323
-
324
-
325
-
326
-
327
-
328
-
329
-
330
 |
 |

1
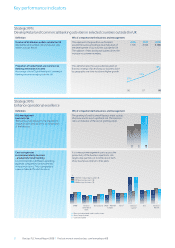
Business review
Barclays PLC Annual Report 2008 17
Financial review
Income statement commentary
Capital due to widening of credit spreads and £1,433m in related income
and hedges. Excluding credit market related losses, gains on own credit
and related income and hedges, income in Barclays Capital increased 6%.
Impairment charges and other credit provisions of £5,419m increased
94% on the prior year. Impairment charges included £1,763m arising from
US sub-prime mortgages and other credit market exposures. Other
wholesale impairment charges increased significantly as corporate credit
conditions turned sharply worse. In Barclays Capital increased charges
also arose in prime services, corporate lending and private equity. In
Barclays Commercial Bank, increased impairment charges reflected the UK
economy moving into recession. In the UK there was a moderate increase
in impairment in UK Retail Banking as a result of book growth and a
deteriorating economic environment. UK mortgage impairment charges
remained low. There was a lower charge in UK cards as net flows into
delinquency and arrears levels reduced. Significant impairment growth in
our Global Retail and Commercial Banking businesses outside the UK
reflected very strong book growth in recent years, and maturation of those
portfolios, together with deteriorating credit conditions and rising
delinquency rates in the US, South Africa and Spain.
Operating expenses increased 9% to £14,366m. We continued to
invest in our distribution network in the Global Retail and Commercial
Banking businesses. Expenses fell in Barclays Capital due to lower
performance related costs. Expenses in Barclays Global Investors included
selective support of liquidity products of £263m (2007: £80m). Group
gains from property disposals were £148m (2007: £267m). Head office
reflects £101m due to the cost of the contribution to the UK Financial
Services Compensation Scheme. Underlying cost growth was well
controlled. The Group cost:income ratio deteriorated by five percentage
points to 62%.
Income statement
Barclays delivered profit before tax of £6,077m in 2008, a decline of 14%
on 2007. The results included the following significant items:
– gains on acquisitions of £2,406m, including £2,262m gain on
acquisition of Lehman Brothers North American businesses
– profit on disposal of Barclays Closed UK Life assurance business of
£326m
– gains on Visa IPO and sales of shares in MasterCard of £291m,
distributed widely across the Group
– gross credit market losses and impairment of £8,053m, or £4,957m net
of related income and hedges of £1,433m and gains on own credit of
£1,663m
Profit after tax increased 4% to £5,287m. This reflected an effective tax
rate of 13% (2007: 28%) primarily due to the gain on the acquisition of
Lehman Brothers North American businesses of £2,262m in part being
offset by carried forward US tax losses attributable to Barclays businesses.
Earnings per share were 59.3p (2007: 68.9p), a decline of 14% from 2007,
reflecting the impact of share issuance during 2008 on the weighted
average number of shares in issue.
Income grew 1% to £23,115m. Income in Global Retail and
Commercial Banking increased 17% and was particularly strong in
businesses outside of the UK to which we have directed significant
resource. Income in Investment Banking and Investment Management
was down 19%. Barclays Capital was affected by very challenging market
conditions in 2008, with income falling by £1,888m (27%) on 2007,
reflecting gross losses of £6,290m relating to credit market assets, partially
offset by gains of £1,663m on the fair valuation of notes issued by Barclays