Barclays 2008 Annual Report Download - page 10
Download and view the complete annual report
Please find page 10 of the 2008 Barclays annual report below. You can navigate through the pages in the report by either clicking on the pages listed below, or by using the keyword search tool below to find specific information within the annual report.-
 1
1 -
 2
2 -
 3
3 -
 4
4 -
 5
5 -
 6
6 -
 7
7 -
 8
8 -
 9
9 -
 10
10 -
 11
11 -
 12
12 -
 13
13 -
 14
14 -
 15
15 -
 16
16 -
 17
17 -
 18
18 -
 19
19 -
 20
20 -
 21
21 -
22
-
23
-
24
-
25
-
26
-
27
-
28
-
29
-
30
-
31
-
32
-
33
-
34
-
35
-
36
-
37
-
38
-
39
-
40
-
41
-
42
-
43
-
44
-
45
-
46
-
47
-
48
-
49
-
50
-
51
-
52
-
53
-
54
-
55
-
56
-
57
-
58
-
59
-
60
-
61
-
62
-
63
-
64
-
65
-
66
-
67
-
68
-
69
-
70
-
71
-
72
-
73
-
74
-
75
-
76
-
77
-
78
-
79
-
80
-
81
-
82
-
83
-
84
-
85
-
86
-
87
-
88
-
89
-
90
-
91
-
92
-
93
-
94
-
95
-
96
-
97
-
98
-
99
-
100
-
101
-
102
-
103
-
104
-
105
-
106
-
107
-
108
-
109
-
110
-
111
-
112
-
113
-
114
-
115
-
116
-
117
-
118
-
119
-
120
-
121
-
122
-
123
-
124
-
125
-
126
-
127
-
128
-
129
-
130
-
131
-
132
-
133
-
134
-
135
-
136
-
137
-
138
-
139
-
140
-
141
-
142
-
143
-
144
-
145
-
146
-
147
-
148
-
149
-
150
-
151
-
152
-
153
-
154
-
155
-
156
-
157
-
158
-
159
-
160
-
161
-
162
-
163
-
164
-
165
-
166
-
167
-
168
-
169
-
170
-
171
-
172
-
173
-
174
-
175
-
176
-
177
-
178
-
179
-
180
-
181
-
182
-
183
-
184
-
185
-
186
-
187
-
188
-
189
-
190
-
191
-
192
-
193
-
194
-
195
-
196
-
197
-
198
-
199
-
200
-
201
-
202
-
203
-
204
-
205
-
206
-
207
-
208
-
209
-
210
-
211
-
212
-
213
-
214
-
215
-
216
-
217
-
218
-
219
-
220
-
221
-
222
-
223
-
224
-
225
-
226
-
227
-
228
-
229
-
230
-
231
-
232
-
233
-
234
-
235
-
236
-
237
-
238
-
239
-
240
-
241
-
242
-
243
-
244
-
245
-
246
-
247
-
248
-
249
-
250
-
251
-
252
-
253
-
254
-
255
-
256
-
257
-
258
-
259
-
260
-
261
-
262
-
263
-
264
-
265
-
266
-
267
-
268
-
269
-
270
-
271
-
272
-
273
-
274
-
275
-
276
-
277
-
278
-
279
-
280
-
281
-
282
-
283
-
284
-
285
-
286
-
287
-
288
-
289
-
290
-
291
-
292
-
293
-
294
-
295
-
296
-
297
-
298
-
299
-
300
-
301
-
302
-
303
-
304
-
305
-
306
-
307
-
308
-
309
-
310
-
311
-
312
-
313
-
314
-
315
-
316
-
317
-
318
-
319
-
320
-
321
-
322
-
323
-
324
-
325
-
326
-
327
-
328
-
329
-
330
 |
 |

8Barclays PLC Annual Report 2008 |Find out more at www.barclays.com/annualreport08
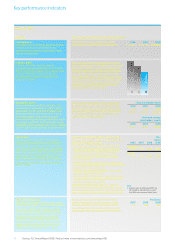
Key performance indicators
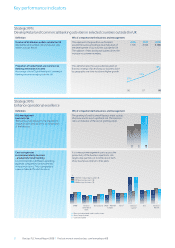
Strategic KPIs
Enhance operational excellence
Risk management
Loan loss rate
The loan loss rate represents the impairment
charge on loans and advances as a proportion
of the balances.
The granting of credit is one of Barclays major sources
of income and its most significant risk. The loan loss
rate is an indicator of the cost of granting credit.
Cost management
cost:income ratio by business
– productivity benchmarking
Cost:income ratio is defined as operating
expenses compared to total income net
of insurance claims. This is compared to
a peer set relevant for each business.
It is a measure management use to assess the
productivity of the business operations. We
target a top quartile cost:income ratio of each
of our businesses relative to their peers.
0.65%
0.71%
0.95%
06
07
08
Why it’s important to the business and management
Barclays PLC Annual Report 2008 8
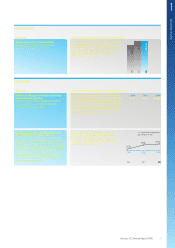
Strategic KPIs
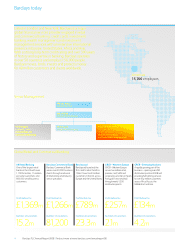
Develop Retail and Commercial Banking activities in selected countries outside the UK
Number of distribution outlets outside the UK
Represents total number of branches and sales
centres outside the UK.
This represents the growth in our footprint
around the world, providing a clear indication of
the development of our activities outside the UK.
The addition of new distribution outlets drives the
increase in customer numbers.
2006 2007 2008
1,705 2,349 3,158
Proportion of Global Retail and Commercial
Banking international income
Percentage of total Global Retail and Commercial
Banking income earned outside the UK.
This demonstrates the successful execution on
Barclays strategy of diversifying our business base
by geography over time to achieve higher growth.
Why it’s important to the business and managementDefinition
Definition
FY08 Peer Group Top Quartile CIR
FY07 Barclays Business CIR
FY08 Barclays Business CIR
Barclays
Wealth
GRCB – Western
Europe
Absa b
Barclays
Commercial
Bank
Barclaycard
BGI
UKRBa
%
Barclays
Capital
c
a Peers include related credit card business
b Absa Group Limited
c Cost:net income
45
57
56
39
36
39
34
43
44
39
72
65
50
52
49
134
63
134
68
62
68
64
76
71
06 07 08
29%
32%
38%