Barclays 2008 Annual Report Download - page 4
Download and view the complete annual report
Please find page 4 of the 2008 Barclays annual report below. You can navigate through the pages in the report by either clicking on the pages listed below, or by using the keyword search tool below to find specific information within the annual report.-
 1
1 -
 2
2 -
 3
3 -
 4
4 -
 5
5 -
 6
6 -
 7
7 -
 8
8 -
 9
9 -
 10
10 -
 11
11 -
 12
12 -
 13
13 -
 14
14 -
 15
15 -
16
-
17
-
18
-
19
-
20
-
21
-
22
-
23
-
24
-
25
-
26
-
27
-
28
-
29
-
30
-
31
-
32
-
33
-
34
-
35
-
36
-
37
-
38
-
39
-
40
-
41
-
42
-
43
-
44
-
45
-
46
-
47
-
48
-
49
-
50
-
51
-
52
-
53
-
54
-
55
-
56
-
57
-
58
-
59
-
60
-
61
-
62
-
63
-
64
-
65
-
66
-
67
-
68
-
69
-
70
-
71
-
72
-
73
-
74
-
75
-
76
-
77
-
78
-
79
-
80
-
81
-
82
-
83
-
84
-
85
-
86
-
87
-
88
-
89
-
90
-
91
-
92
-
93
-
94
-
95
-
96
-
97
-
98
-
99
-
100
-
101
-
102
-
103
-
104
-
105
-
106
-
107
-
108
-
109
-
110
-
111
-
112
-
113
-
114
-
115
-
116
-
117
-
118
-
119
-
120
-
121
-
122
-
123
-
124
-
125
-
126
-
127
-
128
-
129
-
130
-
131
-
132
-
133
-
134
-
135
-
136
-
137
-
138
-
139
-
140
-
141
-
142
-
143
-
144
-
145
-
146
-
147
-
148
-
149
-
150
-
151
-
152
-
153
-
154
-
155
-
156
-
157
-
158
-
159
-
160
-
161
-
162
-
163
-
164
-
165
-
166
-
167
-
168
-
169
-
170
-
171
-
172
-
173
-
174
-
175
-
176
-
177
-
178
-
179
-
180
-
181
-
182
-
183
-
184
-
185
-
186
-
187
-
188
-
189
-
190
-
191
-
192
-
193
-
194
-
195
-
196
-
197
-
198
-
199
-
200
-
201
-
202
-
203
-
204
-
205
-
206
-
207
-
208
-
209
-
210
-
211
-
212
-
213
-
214
-
215
-
216
-
217
-
218
-
219
-
220
-
221
-
222
-
223
-
224
-
225
-
226
-
227
-
228
-
229
-
230
-
231
-
232
-
233
-
234
-
235
-
236
-
237
-
238
-
239
-
240
-
241
-
242
-
243
-
244
-
245
-
246
-
247
-
248
-
249
-
250
-
251
-
252
-
253
-
254
-
255
-
256
-
257
-
258
-
259
-
260
-
261
-
262
-
263
-
264
-
265
-
266
-
267
-
268
-
269
-
270
-
271
-
272
-
273
-
274
-
275
-
276
-
277
-
278
-
279
-
280
-
281
-
282
-
283
-
284
-
285
-
286
-
287
-
288
-
289
-
290
-
291
-
292
-
293
-
294
-
295
-
296
-
297
-
298
-
299
-
300
-
301
-
302
-
303
-
304
-
305
-
306
-
307
-
308
-
309
-
310
-
311
-
312
-
313
-
314
-
315
-
316
-
317
-
318
-
319
-
320
-
321
-
322
-
323
-
324
-
325
-
326
-
327
-
328
-
329
-
330
 |
 |

2Barclays PLC Annual Report 2008 |Find out more at www.barclays.com/annualreport08
Highlights of the year
Group profit before tax was £6,077m, down 14% on 2007. Profit included:
– Gains on acquisitions of £2,406m, including £2,262m relating to Lehman Brothers
North American businesses
– Profit on disposal of the closed life assurance book of £326m
– Gains on Visa IPO and sales of shares in MasterCard of £291m
– Gross credit market losses and impairment of £8,053m
– Gains on own credit of £1,663m
Global Retail and Commercial Banking profit before tax increased 6% to £4,367m
– UK lending increased to both retail and corporate customers
– Strengthened international presence in Barclaycard, Western Europe and Emerging Markets
Investment Banking and Investment Management profit before tax was £2,568m,
down 24% reflecting significant gain on acquisition and disposal and the impact of credit
market dislocation
– Barclays Capital’s strategy of diversification by geography and business accelerated through
the acquisition of Lehman Brothers North American businesses
– There were strong net new asset flows into Barclays Wealth and Barclays Global Investors
despite declines in equity markets
Group balance sheet growth was driven by over £900bn derivative gross-up, growth in loans
and advances of £124bn and impact of foreign exchange rates on non-Sterling assets
Risk weighted assets increased 22% (£79bn) to £433bn reflecting:
– the significant depreciation in Sterling relative to both the US Dollar and the Euro
– procyclicality: macroeconomic indicators generally, and corporate credit conditions specifically,
deteriorated towards the end of 2008 leading to ratings declines
Capital ratios were strengthened through the raising of £13.6bn of Tier 1 capital. The year-end
pro forma Tier 1 capital ratio was 9.7% and the pro forma Equity Tier 1 ratio was 6.7%
Barclays targets reduced adjusted gross leverage and capital ratios significantly ahead of
regulatory requirements
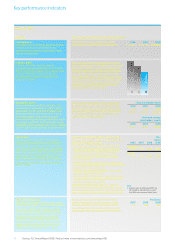
Income statement highlights
For the year ended 31st December
2008 2007 2006
£m £m £m
Total income net of insurance claims 23,115 23,000 21,595
Impairment charges and other credit provisions (5,419) (2,795) (2,154)
Operating expenses (14,366) (13,199) (12,674)
Gains on acquisitions 2,406 ––
Profit before tax 6,077 7,076 7,136
Profit attributable to equity holders of the parent 4,382 4,417 4,571
Basic earnings per share 59.3p 68.9p 71.9p
Dividend per ordinary share 11.5p 34.0p 31.0p
Return on average shareholders’ equity 16.5% 20.3% 24.7%
Cost:income ratio 62% 57% 59%
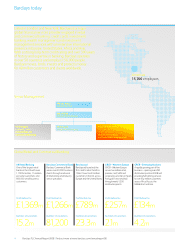
Number of staff 156,300 134,900 122,600
Contribution to group profit
Income
£23,115m
Profit before tax
£6,077m
1
2
3
4
1UK Retail Banking £1,369m
2Barclays Commercial Bank £1,266m
3Barclaycard £789m
4GRCB – Western Europe £257m
5GRCB – Emerging Markets £134m
6GRCB – Absa £552m
56
Global Retail and
Commercial Banking
£4,367m
1
2
3
1Barclays Capital £1,302m
2Barclays Global Investors £595m
3Barclays Wealth £671m
Investment Banking and
Investment Management
£2,568m