BP 2012 Annual Report Download - page 95
Download and view the complete annual report
Please find page 95 of the 2012 BP annual report below. You can navigate through the pages in the report by either clicking on the pages listed below, or by using the keyword search tool below to find specific information within the annual report.-
 1
1 -
2
-
3
-
4
-
5
-
6
-
7
-
8
-
9
-
10
-
11
-
12
-
13
-
14
-
15
-
16
-
17
-
18
-
19
-
20
-
21
-
22
-
23
-
24
-
25
-
26
-
27
-
28
-
29
-
30
-
31
-
32
-
33
-
34
-
35
-
36
-
37
-
38
-
39
-
40
-
41
-
42
-
43
-
44
-
45
-
46
-
47
-
48
-
49
-
50
-
51
-
52
-
53
-
54
-
55
-
56
-
57
-
58
-
59
-
60
-
61
-
62
-
63
-
64
-
65
-
66
-
67
-
68
-
69
-
70
-
71
-
72
-
73
-
74
-
75
-
76
-
77
-
78
-
79
-
80
-
81
-
82
-
83
-
84
-
 85
85 -
 86
86 -
 87
87 -
 88
88 -
 89
89 -
 90
90 -
 91
91 -
 92
92 -
 93
93 -
 94
94 -
 95
95 -
 96
96 -
 97
97 -
 98
98 -
 99
99 -
 100
100 -
 101
101 -
 102
102 -
 103
103 -
 104
104 -
 105
105 -
106
-
107
-
108
-
109
-
110
-
111
-
112
-
113
-
114
-
115
-
116
-
117
-
118
-
119
-
120
-
121
-
122
-
123
-
124
-
125
-
126
-
127
-
128
-
129
-
130
-
131
-
132
-
133
-
134
-
135
-
136
-
137
-
138
-
139
-
140
-
141
-
142
-
143
-
144
-
145
-
146
-
147
-
148
-
149
-
150
-
151
-
152
-
153
-
154
-
155
-
156
-
157
-
158
-
159
-
160
-
161
-
162
-
163
-
164
-
165
-
166
-
167
-
168
-
169
-
170
-
171
-
172
-
173
-
174
-
175
-
176
-
177
-
178
-
179
-
180
-
181
-
182
-
183
-
184
-
185
-
186
-
187
-
188
-
189
-
190
-
191
-
192
-
193
-
194
-
195
-
196
-
197
-
198
-
199
-
200
-
201
-
202
-
203
-
204
-
205
-
206
-
207
-
208
-
209
-
210
-
211
-
212
-
213
-
214
-
215
-
216
-
217
-
218
-
219
-
220
-
221
-
222
-
223
-
224
-
225
-
226
-
227
-
228
-
229
-
230
-
231
-
232
-
233
-
234
-
235
-
236
-
237
-
238
-
239
-
240
-
241
-
242
-
243
-
244
-
245
-
246
-
247
-
248
-
249
-
250
-
251
-
252
-
253
-
254
-
255
-
256
-
257
-
258
-
259
-
260
-
261
-
262
-
263
-
264
-
265
-
266
-
267
-
268
-
269
-
270
-
271
-
272
-
273
-
274
-
275
-
276
-
277
-
278
-
279
-
280
-
281
-
282
-
283
-
284
-
285
-
286
-
287
-
288
-
289
-
290
-
291
-
292
-
293
-
294
-
295
-
296
-
297
-
298
-
299
-
300
-
301
-
302
-
303
 |
 |

Business review: BP in more depth
Business review: BP in more depth
BP Annual Report and Form 20-F 2012
93
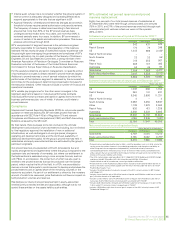
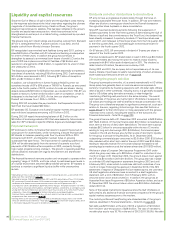
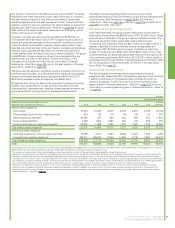
an increase in finance debt of $12 billion over the three-year period. During
this period, the price of Brent crude oil has averaged $100.81 per barrel.
The following table summarizes the three-year sources and uses of cash.
$ billion
Sources of cash:
Net cash provided by operating activities 56
Disposals 32
88
Uses of cash:
Capital expenditure 62
Acquisitions 13
Net repurchase of shares –
Dividends paid to BP shareholders 12
Dividends paid to minority interests 1
88
Net use of cash –
Increase in finance debt 12
Increase in cash and cash equivalents 12
Disposal proceeds received during the three-year period exceeded cash
used for acquisitions, as a result in particular of our ongoing disposal
programme started in 2010. Net investment (capital expenditure and
acquisitions less disposal proceeds) during this period averaged $15 billion
per year. Dividends paid to BP shareholders totalled $12 billion during the
three-year period, with no ordinary share dividends being paid in respect
of the first three quarters of 2010. In the past three years, $4 billion has
been contributed to funded pension plans. This is reflected in net cash
provided by operating activities in the table above.
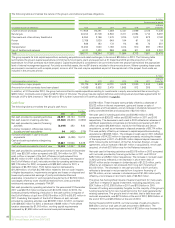
Trend information
For information on external market trends, see Energy outlook on
pages 12-14, Upstream on pages 63-71 and Downstream on pages 72-79.
We expect production in our Upstream segment to be lower in 2013 than
2012, mainly due to the impact of divestments, which we estimate at
around 150mboe/d.
In Downstream, the financial impact of refinery turnarounds for 2013 is
expected to be lower than in 2012. We expect the petrochemicals
margins to remain under pressure during 2013.
In 2013, we expect the average quarterly charge, excluding non-operating
items, for Other businesses and corporate to remain at around $500
million, although this will remain volatile between individual quarters.
We expect capital expenditure, excluding acquisitions and asset
exchanges, to be around $24-25 billion as we invest to grow in the
Upstream. From 2014 through to the end of the decade, we expect a
range for organic capital expenditure of between $24 billion and $27 billion
per annum.
Having essentially reached our $38-billion target of disposals since 2010,
we expect to divest on average of $2-3 billion per annum on an ongoing
basis.
We intend to target our net debt ratio within the 10-20% range while
uncertainties remain. Net debt is a non-GAAP measure.
Depreciation, depletion and amortization in 2013 is expected to be around
$0.5-1.0 billion higher than in 2012.
For 2013, the underlying effective tax rate (ETR) (which excludes
non-operating items and fair value accounting effects) is expected to be in
the range of 36-38% compared with 30% in 2012. The increase in the
forecast rate is mainly due to a lower level of equity-accounted income in
2013, which is reported net of tax in the income statement.
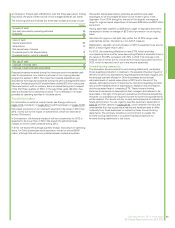
Forward-looking statements
The discussion above contains forward-looking statements, particularly
those regarding production in Upstream, the expected financial impact of
refinery turnarounds, expectations regarding petrochemicals margins and
the average quarterly charge for Other businesses and corporate,
estimated levels of capital expenditure in 2013 and to the end of the
decade, estimated amount of divestments, intentions regarding net debt
ratio and the expected level of depreciation, depletion and amortization,
and the expected level of underlying ETR. These forward-looking
statements are based on assumptions that management believes to be
reasonable in the light of the group’s operational and financial experience.
However, no assurance can be given that the forward-looking statements
will be realized. You should not rely on past performance as an indicator of
future performance. You are urged to read the cautionary statement on
page 32 and Risk factors on pages 38-44, which describe the risks and
uncertainties that may cause actual results and developments to differ
materially from those expressed or implied by these forward-looking
statements. The company provides no commitment to update the
forward-looking statements or to publish financial projections for
forward-looking statements in the future.