BP 2012 Annual Report Download - page 51
Download and view the complete annual report
Please find page 51 of the 2012 BP annual report below. You can navigate through the pages in the report by either clicking on the pages listed below, or by using the keyword search tool below to find specific information within the annual report.-
 1
1 -
2
-
3
-
4
-
5
-
6
-
7
-
8
-
9
-
10
-
11
-
12
-
13
-
14
-
15
-
16
-
17
-
18
-
19
-
20
-
21
-
22
-
23
-
24
-
25
-
26
-
27
-
28
-
29
-
30
-
31
-
32
-
33
-
34
-
35
-
36
-
37
-
38
-
39
-
40
-
 41
41 -
 42
42 -
 43
43 -
 44
44 -
 45
45 -
 46
46 -
 47
47 -
 48
48 -
 49
49 -
 50
50 -
 51
51 -
 52
52 -
 53
53 -
 54
54 -
 55
55 -
 56
56 -
 57
57 -
 58
58 -
 59
59 -
 60
60 -
 61
61 -
62
-
63
-
64
-
65
-
66
-
67
-
68
-
69
-
70
-
71
-
72
-
73
-
74
-
75
-
76
-
77
-
78
-
79
-
80
-
81
-
82
-
83
-
84
-
85
-
86
-
87
-
88
-
89
-
90
-
91
-
92
-
93
-
94
-
95
-
96
-
97
-
98
-
99
-
100
-
101
-
102
-
103
-
104
-
105
-
106
-
107
-
108
-
109
-
110
-
111
-
112
-
113
-
114
-
115
-
116
-
117
-
118
-
119
-
120
-
121
-
122
-
123
-
124
-
125
-
126
-
127
-
128
-
129
-
130
-
131
-
132
-
133
-
134
-
135
-
136
-
137
-
138
-
139
-
140
-
141
-
142
-
143
-
144
-
145
-
146
-
147
-
148
-
149
-
150
-
151
-
152
-
153
-
154
-
155
-
156
-
157
-
158
-
159
-
160
-
161
-
162
-
163
-
164
-
165
-
166
-
167
-
168
-
169
-
170
-
171
-
172
-
173
-
174
-
175
-
176
-
177
-
178
-
179
-
180
-
181
-
182
-
183
-
184
-
185
-
186
-
187
-
188
-
189
-
190
-
191
-
192
-
193
-
194
-
195
-
196
-
197
-
198
-
199
-
200
-
201
-
202
-
203
-
204
-
205
-
206
-
207
-
208
-
209
-
210
-
211
-
212
-
213
-
214
-
215
-
216
-
217
-
218
-
219
-
220
-
221
-
222
-
223
-
224
-
225
-
226
-
227
-
228
-
229
-
230
-
231
-
232
-
233
-
234
-
235
-
236
-
237
-
238
-
239
-
240
-
241
-
242
-
243
-
244
-
245
-
246
-
247
-
248
-
249
-
250
-
251
-
252
-
253
-
254
-
255
-
256
-
257
-
258
-
259
-
260
-
261
-
262
-
263
-
264
-
265
-
266
-
267
-
268
-
269
-
270
-
271
-
272
-
273
-
274
-
275
-
276
-
277
-
278
-
279
-
280
-
281
-
282
-
283
-
284
-
285
-
286
-
287
-
288
-
289
-
290
-
291
-
292
-
293
-
294
-
295
-
296
-
297
-
298
-
299
-
300
-
301
-
302
-
303
 |
 |

Business review: BP in more depth
Business review: BP in more depth
BP Annual Report and Form 20-F 2012
49
Senior downstream leaders, led by the segment chief executive,
participate in the segment operations risk committee, which provides
leadership and expectations on the management of operations. Quarterly,
this committee also reviews safety and operations performance
indicators. All of our businesses use a set of common leading and lagging
safety metrics that are intended to monitor performance and help identify
opportunities for improvement.
BP continues to implement the BP US Refineries Independent Safety
Review Panel recommendations as part of ongoing process safety
management.
Risk management
Hazard identification and risk management are key components of our
OMS and are fundamental to the success of safely managing
hydrocarbons. Over the past two years, our Downstream business has
implemented a risk management programme under OMS that focuses on
identification, assessment, response and action to manage safety and
operational risk combined with monitoring and review of identified and
newly emerging risks.
Management plans for the Downstream businesses’ high-consequence,
low-probability risks are reviewed annually by the segment chief executive
and the chief operating officers.
Some examples of specific risk reduction work across our refining and
petrochemicals portfolio in 2012 include:
t Installation of additional safety instrumentation and equipment to
reduce the likelihood of identified risks occurring.
t Continuing work to improve the safety of site occupied buildings. We
have a major programme under way to install safety shelters for
personnel; to move people further away from hydrocarbon-containing
equipment; and to reduce the number of vehicles onsite. For example,
during 2012 a building-hardening programme was completed at our
Toledo refinery, and at our Bulwer refinery we constructed new offices
to move employees away from higher risk processing areas. The
business also continues to train and drill personnel to respond to
emergencies.
t Work to reduce explosion and toxic risks through inventory reduction
by, for example, reducing ethylene and propylene refrigerants in our
petrochemical plants and by eliminating or reducing the use of ammonia
across the refining portfolio.
Where similar risks have been identified across multiple facilities, new
guidance for gasoline storage, tanker loading and buildings were
developed and issued to drive consistent risk mitigation efforts across the
segment.
Capability development
Each facility has experienced and trained operational staff and a system
for assessing their competency. We are developing a consistent
competency framework that standardizes this assessment process for
safety-critical roles supported by and in conjunction with S&OR direction
and expertise.
To support the competency development plan for operations personnel,
our refineries and chemical manufacturing plants are in the process of
installing high fidelity process simulators for selected process units.
These will be used to train operators via simulations to respond to
low-probability, high-consequence scenarios, similar to methods used
with airline pilots.
Measurement, evaluation and corrective action
The oversight of the management of hydrocarbons across our operations
is supported by our S&OR function. S&OR personnel work with our
operating businesses to provide independent perspectives on the quality
of our operations and the management of risks.
A quarterly assurance process enables S&OR to provide an ongoing
independent view of OMS conformance by the sites. Each site is
assessed on its OMS self-verification processes, the strength of existing
risk mitigations and progress on risk reduction plans. Periodic S&OR
audits against OMS requirements also provide valuable insights and result
in actions to close any identified findings.
Lessons learned from incidents and near-misses are important for
identifying ways to improve safety practices. In 2012 we issued a number
of briefings and alerts on lessons learned from incidents and near-misses
and we require our sites to provide assurance that similar risks have been
assessed and appropriate corrective actions undertaken.
New process safety expert for our Downstream business
Duane Wilson’s five-year board appointment as independent expert to
provide an independent objective assessment of BP’s progress in
implementing the recommendations of the BP US Refineries Independent
Safety Review Panel came to an end in May 2012. Recognizing the
extensive experience he has acquired during his years as independent
expert and following the end of his term, SEEAC appointed him as
process safety expert and assigned him to work, in a global capacity, with
the Downstream business.
In this new role, he is providing an independent perspective on the
progress that BP’s fuels and petrochemicals businesses are making
globally toward becoming industry leaders in process safety performance.
Specifically, Duane Wilson is focusing and reporting to the SEEAC on
three topics:
t Downstream’s prioritization of the agenda to become an industry leader
in process safety.
t Downstream’s progress in embedding BP’s OMS – including process
safety risk assessment processes, process safety culture and
interpretation of trends in process safety performance.
t The effectiveness of the Downstream safety and operational risk
function’s agenda.
Duane Wilson continues to have frequent and direct access not only to
the board, but also to BP employees from the most senior executives
down to the shop floor. He visits facilities, conducts interviews and
reviews relevant documents, such as audit and incident reports, to fulfil
his duties. Additionally, he is an ex officio member of the Downstream
segment operations risk committee and regularly attends its meetings
with the senior executives of the business. His contract is for a two-year
term ending in May 2014, and may be renewed for up to an additional two
years on mutual agreement.
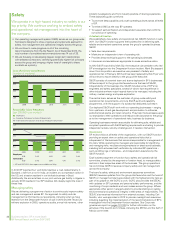
Safety performance
Workforce fatalities
In 2012 BP reported four workforce fatalities: a road related fatality in
Scotland; a fall from a roof in India; an incident at a compressor station in
the US; and a tractor accident in our biofuels business in Brazil.
Additionally, the armed attack on our joint venture gas facility in Algeria in
January 2013 resulted in four BP fatalities. We deeply regret the loss of
these lives.
Oil spills and other loss of primary containment
We monitor the integrity of our assets used to produce, process and
transport oil and other hydrocarbons with the aim of preventing the loss of
material from its primary containment.
Accordingly, we track loss of primary containment as a metric, which
includes unplanned or uncontrolled releases from a tank, vessel, pipe, rail
car or equipment used for containment or transfer of materials within our
operational boundary, excluding non-hazardous releases such as water.
The US government and third parties have announced various estimates
of the flow rate or total volume of oil spilled from the Deepwater Horizon
incident. The multi-district litigation pending in New Orleans will address
the amount of oil spilled. See Financial statements – Note 36 on page 235
for information about the volume used to determine the estimated
liabilities.