BP 2012 Annual Report Download - page 243
Download and view the complete annual report
Please find page 243 of the 2012 BP annual report below. You can navigate through the pages in the report by either clicking on the pages listed below, or by using the keyword search tool below to find specific information within the annual report.-
 1
1 -
2
-
3
-
4
-
5
-
6
-
7
-
8
-
9
-
10
-
11
-
12
-
13
-
14
-
15
-
16
-
17
-
18
-
19
-
20
-
21
-
22
-
23
-
24
-
25
-
26
-
27
-
28
-
29
-
30
-
31
-
32
-
33
-
34
-
35
-
36
-
37
-
38
-
39
-
40
-
41
-
42
-
43
-
44
-
45
-
46
-
47
-
48
-
49
-
50
-
51
-
52
-
53
-
54
-
55
-
56
-
57
-
58
-
59
-
60
-
61
-
62
-
63
-
64
-
65
-
66
-
67
-
68
-
69
-
70
-
71
-
72
-
73
-
74
-
75
-
76
-
77
-
78
-
79
-
80
-
81
-
82
-
83
-
84
-
85
-
86
-
87
-
88
-
89
-
90
-
91
-
92
-
93
-
94
-
95
-
96
-
97
-
98
-
99
-
100
-
101
-
102
-
103
-
104
-
105
-
106
-
107
-
108
-
109
-
110
-
111
-
112
-
113
-
114
-
115
-
116
-
117
-
118
-
119
-
120
-
121
-
122
-
123
-
124
-
125
-
126
-
127
-
128
-
129
-
130
-
131
-
132
-
133
-
134
-
135
-
136
-
137
-
138
-
139
-
140
-
141
-
142
-
143
-
144
-
145
-
146
-
147
-
148
-
149
-
150
-
151
-
152
-
153
-
154
-
155
-
156
-
157
-
158
-
159
-
160
-
161
-
162
-
163
-
164
-
165
-
166
-
167
-
168
-
169
-
170
-
171
-
172
-
173
-
174
-
175
-
176
-
177
-
178
-
179
-
180
-
181
-
182
-
183
-
184
-
185
-
186
-
187
-
188
-
189
-
190
-
191
-
192
-
193
-
194
-
195
-
196
-
197
-
198
-
199
-
200
-
201
-
202
-
203
-
204
-
205
-
206
-
207
-
208
-
209
-
210
-
211
-
212
-
213
-
214
-
215
-
216
-
217
-
218
-
219
-
220
-
221
-
222
-
223
-
224
-
225
-
226
-
227
-
228
-
229
-
230
-
231
-
232
-
 233
233 -
 234
234 -
 235
235 -
 236
236 -
 237
237 -
 238
238 -
 239
239 -
 240
240 -
 241
241 -
 242
242 -
 243
243 -
 244
244 -
 245
245 -
 246
246 -
 247
247 -
 248
248 -
 249
249 -
 250
250 -
 251
251 -
 252
252 -
 253
253 -
254
-
255
-
256
-
257
-
258
-
259
-
260
-
261
-
262
-
263
-
264
-
265
-
266
-
267
-
268
-
269
-
270
-
271
-
272
-
273
-
274
-
275
-
276
-
277
-
278
-
279
-
280
-
281
-
282
-
283
-
284
-
285
-
286
-
287
-
288
-
289
-
290
-
291
-
292
-
293
-
294
-
295
-
296
-
297
-
298
-
299
-
300
-
301
-
302
-
303
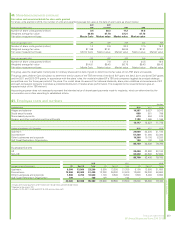
 |
 |

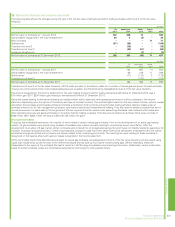
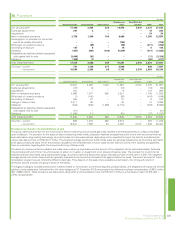
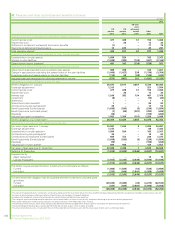
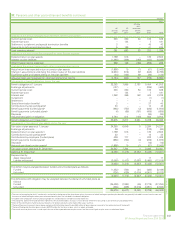
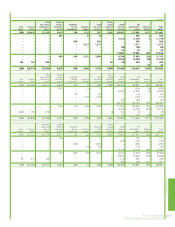
2012 2011 2010
Interest
rate
Market
value
Expected
long-term
rate of
return
Market
value
Expected
long-term
rate of
return
Market
value
% $ million % $ million % $ million
UK pension plans
Equitiesa19,612 8.0 17,202 8.0 18,546
Bonds 4,885 4.4 4,141 5.0 3,866
Property/real estate 1,783 6.5 1,710 6.5 1,462
Cash 1,066 1.7 534 1.4 406
4.4 27,346 7.0 23,587 7.2 24,280
US pension plans
Equitiesa5,431 9.0 5,034 9.1 5,058
Bonds 2,159 4.0 2,022 4.5 1,419
Property/real estate 58.0 4 8.0 7
Cash 191 0.2 144 0.3 165
3.2 7,786 7.4 7,204 8.0 6,649
US other post-retirement benefit plans
Cash 10.2 4 0.3 8
3.7 1 0.2 4 0.3 8
Other plans
Equities 940 7.9 831 8.0 1,182
Bonds 2,114 3.3 1,951 4.2 1,874
Property/real estate 139 6.2 117 6.3 83
Cash 340 2.2 387 2.7 155
3.6 3,533 4.7 3,286 5.4 3,294
aThe amounts classified as equities include investments in companies listed on stock exchanges as well as private equity investments which are substantially all unlisted. The market value of private
equity investments at 31 December 2012 was $4,354 million (2011 $4,099 million and 2010 $3,348 million). The equity return assumption shown above for 2011 and 2010 is the weighted average of the
assumed returns for listed and private equity assets in each fund.
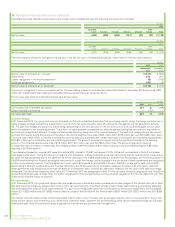
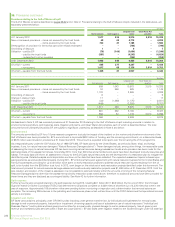
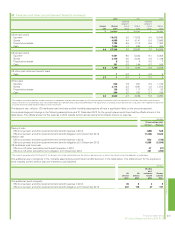
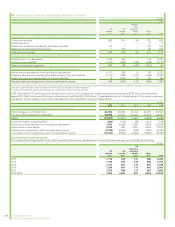
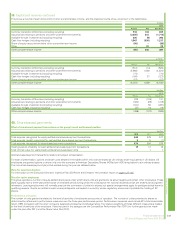
The discount rate, inflation, US healthcare cost trend rate and the mortality assumptions all have a significant effect on the amounts reported.
A one-percentage point change in the following assumptions as at 31 December 2012 for the group’s plans would have had the effects shown in the
table below. The effects shown for the expense in 2013 include current service cost and net finance income or expense.
$ million
One percentage point
Increase Decrease
Discount ratea
Effect on pension and other post-retirement benefit expense in 2013 (480) 528
Effect on pension and other post-retirement benefit obligation at 31 December 2012 (7,364) 9,626
Inflation rate
Effect on pension and other post-retirement benefit expense in 2013 553 (410)
Effect on pension and other post-retirement benefit obligation at 31 December 2012 6,986 (5,580)
US healthcare cost trend rate
Effect on US other post-retirement benefit expense in 2013 27 (21)
Effect on US other post-retirement obligation at 31 December 2012 321 (265)
aThe amounts presented reflect that from 2013, the discount rate will be used to determine the return on pension assets as well as the interest cost on the obligation, as noted above.
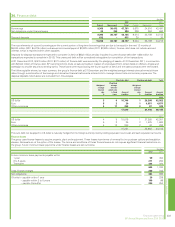
One additional year of longevity in the mortality assumptions would have the effects shown in the table below. The effect shown for the expense in
2013 includes current service cost and interest on plan liabilities.
$ million
UK
pension
plans
US
pension
plans
US other
post-
retirement
benefit
plans
German
pension
plans
One additional year’s longevity
Effect on pension and other post-retirement benefit expense in 2013 39 5 3 8
Effect on pension and other post-retirement benefit obligation at 31 December 2012 647 118 67 197
Financial statements 241
BP Annual Report and Form 20-F 2012
Financial statements
37. Pensions and other post-retirement benefits continued