BP 2012 Annual Report Download - page 297
Download and view the complete annual report
Please find page 297 of the 2012 BP annual report below. You can navigate through the pages in the report by either clicking on the pages listed below, or by using the keyword search tool below to find specific information within the annual report.-
 1
1 -
2
-
3
-
4
-
5
-
6
-
7
-
8
-
9
-
10
-
11
-
12
-
13
-
14
-
15
-
16
-
17
-
18
-
19
-
20
-
21
-
22
-
23
-
24
-
25
-
26
-
27
-
28
-
29
-
30
-
31
-
32
-
33
-
34
-
35
-
36
-
37
-
38
-
39
-
40
-
41
-
42
-
43
-
44
-
45
-
46
-
47
-
48
-
49
-
50
-
51
-
52
-
53
-
54
-
55
-
56
-
57
-
58
-
59
-
60
-
61
-
62
-
63
-
64
-
65
-
66
-
67
-
68
-
69
-
70
-
71
-
72
-
73
-
74
-
75
-
76
-
77
-
78
-
79
-
80
-
81
-
82
-
83
-
84
-
85
-
86
-
87
-
88
-
89
-
90
-
91
-
92
-
93
-
94
-
95
-
96
-
97
-
98
-
99
-
100
-
101
-
102
-
103
-
104
-
105
-
106
-
107
-
108
-
109
-
110
-
111
-
112
-
113
-
114
-
115
-
116
-
117
-
118
-
119
-
120
-
121
-
122
-
123
-
124
-
125
-
126
-
127
-
128
-
129
-
130
-
131
-
132
-
133
-
134
-
135
-
136
-
137
-
138
-
139
-
140
-
141
-
142
-
143
-
144
-
145
-
146
-
147
-
148
-
149
-
150
-
151
-
152
-
153
-
154
-
155
-
156
-
157
-
158
-
159
-
160
-
161
-
162
-
163
-
164
-
165
-
166
-
167
-
168
-
169
-
170
-
171
-
172
-
173
-
174
-
175
-
176
-
177
-
178
-
179
-
180
-
181
-
182
-
183
-
184
-
185
-
186
-
187
-
188
-
189
-
190
-
191
-
192
-
193
-
194
-
195
-
196
-
197
-
198
-
199
-
200
-
201
-
202
-
203
-
204
-
205
-
206
-
207
-
208
-
209
-
210
-
211
-
212
-
213
-
214
-
215
-
216
-
217
-
218
-
219
-
220
-
221
-
222
-
223
-
224
-
225
-
226
-
227
-
228
-
229
-
230
-
231
-
232
-
233
-
234
-
235
-
236
-
237
-
238
-
239
-
240
-
241
-
242
-
243
-
244
-
245
-
246
-
247
-
248
-
249
-
250
-
251
-
252
-
253
-
254
-
255
-
256
-
257
-
258
-
259
-
260
-
261
-
262
-
263
-
264
-
265
-
266
-
267
-
268
-
269
-
270
-
271
-
272
-
273
-
274
-
275
-
276
-
277
-
278
-
279
-
280
-
281
-
282
-
283
-
284
-
285
-
286
-
 287
287 -
 288
288 -
 289
289 -
 290
290 -
 291
291 -
 292
292 -
 293
293 -
 294
294 -
 295
295 -
 296
296 -
 297
297 -
 298
298 -
 299
299 -
 300
300 -
 301
301 -
 302
302 -
 303
303
 |
 |

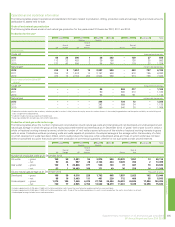
$ million
2012 2011
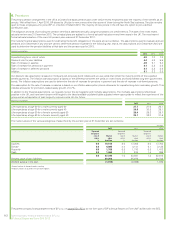
Analysis of the amount charged to operating profit
Current service costa477 380
Settlement, curtailment and special termination benefitsb(1) 3
Payments to defined contribution plans 14 5
Total operating chargec490 388
Analysis of the amount credited (charged) to other finance income
Expected return on pension plan assets 1,680 1,773
Interest on pension plan liabilities (1,249) (1,240)
Other finance income 431 533
Analysis of the amount recognized in statement of total recognized gains and losses
Actual return less expected return on pension plan assets 989 (1,976)
Change in assumptions underlying the present value of the plan liabilities (1,446) (2,710)
Experience gains and losses arising on the plan liabilities (116) (84)
Actuarial loss recognized in statement of total recognized gains and losses (573) (4,770)
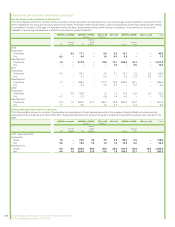
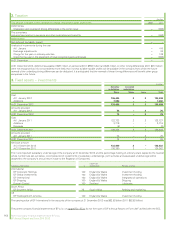
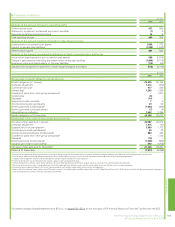
$ million
2012 2011
Movements in benefit obligation during the year
Benefit obligation at 1 January 25,675 20,742
Exchange adjustment 1,313 (204)
Current service costa477 380
Interest cost 1,249 1,240
Transfers of plans from other group companiesd–1,671
Curtailments (8) –
Disposals (10) –
Special termination benefits 73
Contributions by plan participants 39 33
Benefit payments (funded plans)e(1,038) (980)
Benefit payments (unfunded plans)e(7) (4)
Actuarial loss on obligation 1,562 2,794
Benefit obligation at 31 December 29,259 25,675
Movements in fair value of plan assets during the year
Fair value of plan assets at 1 January 23,587 22,612
Exchange adjustment 1,215 (41)
Expected return on plan assetsaf 1,680 1,773
Contributions by plan participantsg39 33
Contributions by employers (funded plans) 884 423
Transfers of plans from other group companiesd–1,743
Disposals (10) –
Benefit payments (funded plans)e(1,038) (980)
Actuarial gain (loss) on plan assetsf989 (1,976)
Fair value of plan assets at 31 Decemberh27,346 23,587
Deficit at 31 December (1,913) (2,088)
aThe costs of managing the plan’s investments are treated as being part of the investment return, the costs of administering our pensions plan benefits are included in current service cost.
bThe charge for special termination benefits represents the increased liability arising as a result of early retirements occurring as part of restructuring programmes.
cIncluded within production and manufacturing expenses and distribution and administration expenses.
dTransfer of the Burmah Castrol Pension Fund and the Lubricants UK Limited pension plan.
eThe benefit payments amount shown above comprises $1,022 million benefits plus $16 million of plan expenses incurred in the administration of the benefit.
fThe actual return on plan assets is made up of the sum of the expected return on plan assets and the actuarial gain or loss on the plan assets as disclosed above.
gThe contributions by plan participants for the UK mostly comprise contributions made under salary sacrifice arrangements.
hReflects $27,220 million of assets held in the BP Pension Fund (2011 $23,482 million) and $94 million held in the BP Global Pension Trust (2011 $75 million), with $32 million representing the company’s
share of Merchant Navy Officers Pension Fund (2011 $30 million).
Parent company financial statements of BP p.l.c. PC8
BP Annual Report and Form 20-F 2012
Financial statements
6. Pensions continued
The parent company financial statements of BP p.l.c. on pages PC1–PC11 do not form part of BP’s Annual Report on Form 20-F as filed with the SEC.