BP 2012 Annual Report Download - page 207
Download and view the complete annual report
Please find page 207 of the 2012 BP annual report below. You can navigate through the pages in the report by either clicking on the pages listed below, or by using the keyword search tool below to find specific information within the annual report.-
 1
1 -
2
-
3
-
4
-
5
-
6
-
7
-
8
-
9
-
10
-
11
-
12
-
13
-
14
-
15
-
16
-
17
-
18
-
19
-
20
-
21
-
22
-
23
-
24
-
25
-
26
-
27
-
28
-
29
-
30
-
31
-
32
-
33
-
34
-
35
-
36
-
37
-
38
-
39
-
40
-
41
-
42
-
43
-
44
-
45
-
46
-
47
-
48
-
49
-
50
-
51
-
52
-
53
-
54
-
55
-
56
-
57
-
58
-
59
-
60
-
61
-
62
-
63
-
64
-
65
-
66
-
67
-
68
-
69
-
70
-
71
-
72
-
73
-
74
-
75
-
76
-
77
-
78
-
79
-
80
-
81
-
82
-
83
-
84
-
85
-
86
-
87
-
88
-
89
-
90
-
91
-
92
-
93
-
94
-
95
-
96
-
97
-
98
-
99
-
100
-
101
-
102
-
103
-
104
-
105
-
106
-
107
-
108
-
109
-
110
-
111
-
112
-
113
-
114
-
115
-
116
-
117
-
118
-
119
-
120
-
121
-
122
-
123
-
124
-
125
-
126
-
127
-
128
-
129
-
130
-
131
-
132
-
133
-
134
-
135
-
136
-
137
-
138
-
139
-
140
-
141
-
142
-
143
-
144
-
145
-
146
-
147
-
148
-
149
-
150
-
151
-
152
-
153
-
154
-
155
-
156
-
157
-
158
-
159
-
160
-
161
-
162
-
163
-
164
-
165
-
166
-
167
-
168
-
169
-
170
-
171
-
172
-
173
-
174
-
175
-
176
-
177
-
178
-
179
-
180
-
181
-
182
-
183
-
184
-
185
-
186
-
187
-
188
-
189
-
190
-
191
-
192
-
193
-
194
-
195
-
196
-
 197
197 -
 198
198 -
 199
199 -
 200
200 -
 201
201 -
 202
202 -
 203
203 -
 204
204 -
 205
205 -
 206
206 -
 207
207 -
 208
208 -
 209
209 -
 210
210 -
 211
211 -
 212
212 -
 213
213 -
 214
214 -
 215
215 -
 216
216 -
 217
217 -
218
-
219
-
220
-
221
-
222
-
223
-
224
-
225
-
226
-
227
-
228
-
229
-
230
-
231
-
232
-
233
-
234
-
235
-
236
-
237
-
238
-
239
-
240
-
241
-
242
-
243
-
244
-
245
-
246
-
247
-
248
-
249
-
250
-
251
-
252
-
253
-
254
-
255
-
256
-
257
-
258
-
259
-
260
-
261
-
262
-
263
-
264
-
265
-
266
-
267
-
268
-
269
-
270
-
271
-
272
-
273
-
274
-
275
-
276
-
277
-
278
-
279
-
280
-
281
-
282
-
283
-
284
-
285
-
286
-
287
-
288
-
289
-
290
-
291
-
292
-
293
-
294
-
295
-
296
-
297
-
298
-
299
-
300
-
301
-
302
-
303
 |
 |

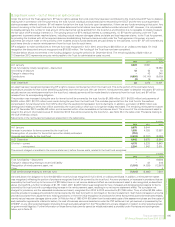
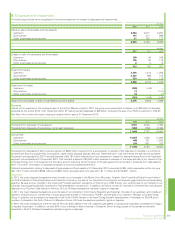
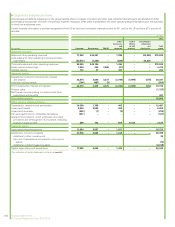
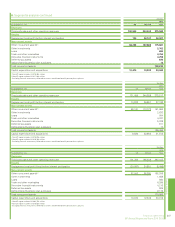
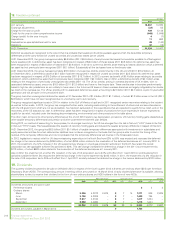
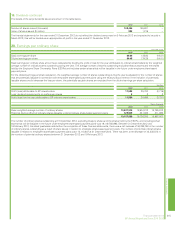
6. Segmental analysis continued
$ million
2011
By business Upstream Downstream TNK-BP
Other
businesses
and
corporate
Gulf of
Mexico
oil spill
response
Consolidation
adjustment
and
eliminations
Total
group
Segment revenues
Sales and other operating revenues 75,475 344,116 – 2,957 – (47,031) 375,517
Less: sales and other operating revenues between
businesses (44,766) (1,396) – (869) – 47,031 –
Third party sales and other operating revenues 30,709 342,720 – 2,088 – – 375,517
Equity-accounted earnings 1,281 787 4,185 (33) – – 6,220
Interest income (4) 25 – 146 – – 167
Segment results
Replacement cost profit (loss) before interest
and taxation 26,366 5,474 4,134 (2,478) 3,800 (113) 37,183
Inventory holding gainsa81 2,487 51 15 – – 2,634
Profit (loss) before interest and taxation 26,447 7,961 4,185 (2,463) 3,800 (113) 39,817
Finance costs (1,246)
Net finance income relating to pensions and other
post-retirement benefits 263
Profit before taxation 38,834
Other income statement items
Depreciation, depletion and amortization 8,693 2,117 – 325 – – 11,135
Impairment losses 1,443 599 – 58 – – 2,100
Impairment reversals (146) – – – – – (146)
Fair value (gain) loss on embedded derivatives (191) – – 123 – – (68)
Charges for provisions, net of write-back of unused
provisions, including change in discount rate 213 371 – 942 5,200 – 6,726
Segment assets
Equity-accounted investments 11,041 6,731 10,013 1,024 – – 28,809
Additions to non-current assets 34,527 4,128 – 1,864 – – 40,519
Additions to other investments 25
Element of acquisitions not related to non-current
assets (1,089)
Additions to decommissioning asset (7,937)
Capital expenditure and acquisitions 25,535 4,130 – 1,853 – – 31,518
aSee explanation of inventory holding gains and losses on page 203.
Financial statements 205
BP Annual Report and Form 20-F 2012
Financial statements