BP 2012 Annual Report Download - page 231
Download and view the complete annual report
Please find page 231 of the 2012 BP annual report below. You can navigate through the pages in the report by either clicking on the pages listed below, or by using the keyword search tool below to find specific information within the annual report.-
 1
1 -
2
-
3
-
4
-
5
-
6
-
7
-
8
-
9
-
10
-
11
-
12
-
13
-
14
-
15
-
16
-
17
-
18
-
19
-
20
-
21
-
22
-
23
-
24
-
25
-
26
-
27
-
28
-
29
-
30
-
31
-
32
-
33
-
34
-
35
-
36
-
37
-
38
-
39
-
40
-
41
-
42
-
43
-
44
-
45
-
46
-
47
-
48
-
49
-
50
-
51
-
52
-
53
-
54
-
55
-
56
-
57
-
58
-
59
-
60
-
61
-
62
-
63
-
64
-
65
-
66
-
67
-
68
-
69
-
70
-
71
-
72
-
73
-
74
-
75
-
76
-
77
-
78
-
79
-
80
-
81
-
82
-
83
-
84
-
85
-
86
-
87
-
88
-
89
-
90
-
91
-
92
-
93
-
94
-
95
-
96
-
97
-
98
-
99
-
100
-
101
-
102
-
103
-
104
-
105
-
106
-
107
-
108
-
109
-
110
-
111
-
112
-
113
-
114
-
115
-
116
-
117
-
118
-
119
-
120
-
121
-
122
-
123
-
124
-
125
-
126
-
127
-
128
-
129
-
130
-
131
-
132
-
133
-
134
-
135
-
136
-
137
-
138
-
139
-
140
-
141
-
142
-
143
-
144
-
145
-
146
-
147
-
148
-
149
-
150
-
151
-
152
-
153
-
154
-
155
-
156
-
157
-
158
-
159
-
160
-
161
-
162
-
163
-
164
-
165
-
166
-
167
-
168
-
169
-
170
-
171
-
172
-
173
-
174
-
175
-
176
-
177
-
178
-
179
-
180
-
181
-
182
-
183
-
184
-
185
-
186
-
187
-
188
-
189
-
190
-
191
-
192
-
193
-
194
-
195
-
196
-
197
-
198
-
199
-
200
-
201
-
202
-
203
-
204
-
205
-
206
-
207
-
208
-
209
-
210
-
211
-
212
-
213
-
214
-
215
-
216
-
217
-
218
-
219
-
220
-
 221
221 -
 222
222 -
 223
223 -
 224
224 -
 225
225 -
 226
226 -
 227
227 -
 228
228 -
 229
229 -
 230
230 -
 231
231 -
 232
232 -
 233
233 -
 234
234 -
 235
235 -
 236
236 -
 237
237 -
 238
238 -
 239
239 -
 240
240 -
 241
241 -
242
-
243
-
244
-
245
-
246
-
247
-
248
-
249
-
250
-
251
-
252
-
253
-
254
-
255
-
256
-
257
-
258
-
259
-
260
-
261
-
262
-
263
-
264
-
265
-
266
-
267
-
268
-
269
-
270
-
271
-
272
-
273
-
274
-
275
-
276
-
277
-
278
-
279
-
280
-
281
-
282
-
283
-
284
-
285
-
286
-
287
-
288
-
289
-
290
-
291
-
292
-
293
-
294
-
295
-
296
-
297
-
298
-
299
-
300
-
301
-
302
-
303
 |
 |

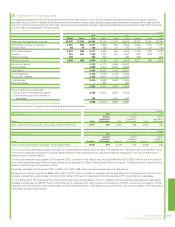
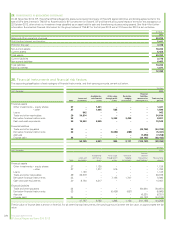
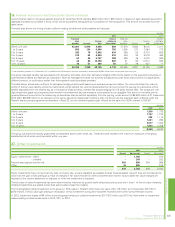
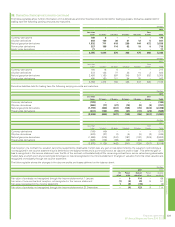
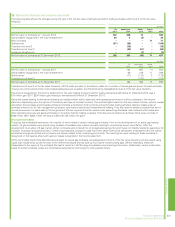
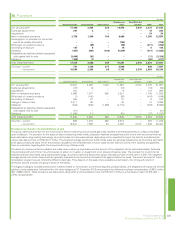
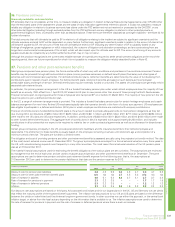
The following tables show further information on the derivatives and other financial instruments held for trading purposes. Derivative assets held for
trading have the following carrying amounts and maturities.
$ million
2012
Less than
1 year 1-2 years 2-3 years 3-4 years 4-5 years
Over
5 years Total
Currency derivatives 169 6 – – – – 175
Oil price derivatives 656 109 38 21 12 5 841
Natural gas price derivatives 1,532 711 418 259 144 472 3,536
Power price derivatives 327 188 114 62 19 9 719
Equity price derivatives 71–––––71
2,755 1,014 570 342 175 486 5,342
$ million
2011
Less than
1 year 1-2 years 2-3 years 3-4 years 4-5 years
Over
5 years Total
Currency derivatives 194 18 5 – – – 217
Oil price derivatives 573 135 77 25 10 3 823
Natural gas price derivatives 2,493 1,160 597 346 207 502 5,305
Power price derivatives 498 160 101 54 30 – 843
3,758 1,473 780 425 247 505 7,188
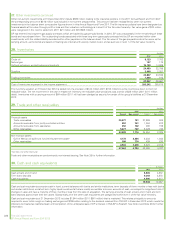
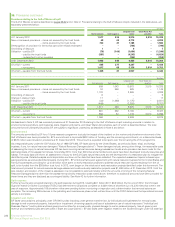
Derivative liabilities held for trading have the following carrying amounts and maturities.
$ million
2012
Less than
1 year 1-2 years 2-3 years 3-4 years 4-5 years
Over
5 years Total
Currency derivatives (189) – – – – – (189)
Oil price derivatives (580) (77) (27) (12) (8) (3) (707)
Natural gas price derivatives (1,199) (440) (241) (135) (78) (403) (2,496)
Power price derivatives (341) (133) (59) (21) (10) (25) (589)
(2,309) (650) (327) (168) (96) (431) (3,981)
$ million
2011
Less than
1 year 1-2 years 2-3 years 3-4 years 4-5 years
Over
5 years Total
Currency derivatives (168) (49) – – – – (217)
Oil price derivatives (483) (37) (7) (4) (3) (2) (536)
Natural gas price derivatives (1,696) (876) (347) (197) (102) (385) (3,603)
Power price derivatives (328) (176) (89) (46) (24) – (663)
(2,675) (1,138) (443) (247) (129) (387) (5,019)
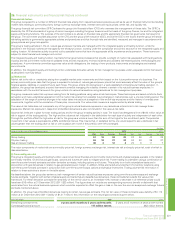
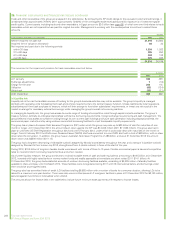
If at inception of a contract the valuation cannot be supported by observable market data, any gain or loss determined by the valuation methodology is
not recognized in the income statement but is deferred on the balance sheet and is commonly known as ‘day-one profit or loss’. This deferred gain or
loss is recognized in the income statement over the life of the contract until substantially all the remaining contract term can be valued using observable
market data at which point any remaining deferred gain or loss is recognized in the income statement. Changes in valuation from this initial valuation are
recognized immediately through the income statement.
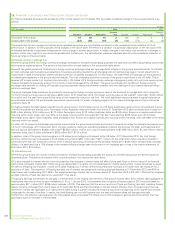
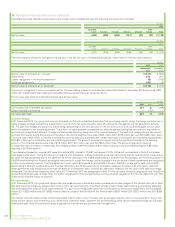
The following table shows the changes in the day-one profits and losses deferred on the balance sheet.
$ million
2012 2011
Oil
price
Power
price
Natural
gas price
Power
price
Natural
gas price
Fair value of contracts not recognized through the income statement at 1 January – 9 114 –69
Fair value of new contracts at inception not recognized in the income statement (1) (4) 28 951
Fair value recognized in the income statement 1 (9) (19) – (6)
Fair value of contracts not recognized through the income statement at 31 December – (4) 123 9 114
Financial statements 229
BP Annual Report and Form 20-F 2012
Financial statements
33. Derivative financial instruments continued