BP 2012 Annual Report Download - page 260
Download and view the complete annual report
Please find page 260 of the 2012 BP annual report below. You can navigate through the pages in the report by either clicking on the pages listed below, or by using the keyword search tool below to find specific information within the annual report.-
 1
1 -
2
-
3
-
4
-
5
-
6
-
7
-
8
-
9
-
10
-
11
-
12
-
13
-
14
-
15
-
16
-
17
-
18
-
19
-
20
-
21
-
22
-
23
-
24
-
25
-
26
-
27
-
28
-
29
-
30
-
31
-
32
-
33
-
34
-
35
-
36
-
37
-
38
-
39
-
40
-
41
-
42
-
43
-
44
-
45
-
46
-
47
-
48
-
49
-
50
-
51
-
52
-
53
-
54
-
55
-
56
-
57
-
58
-
59
-
60
-
61
-
62
-
63
-
64
-
65
-
66
-
67
-
68
-
69
-
70
-
71
-
72
-
73
-
74
-
75
-
76
-
77
-
78
-
79
-
80
-
81
-
82
-
83
-
84
-
85
-
86
-
87
-
88
-
89
-
90
-
91
-
92
-
93
-
94
-
95
-
96
-
97
-
98
-
99
-
100
-
101
-
102
-
103
-
104
-
105
-
106
-
107
-
108
-
109
-
110
-
111
-
112
-
113
-
114
-
115
-
116
-
117
-
118
-
119
-
120
-
121
-
122
-
123
-
124
-
125
-
126
-
127
-
128
-
129
-
130
-
131
-
132
-
133
-
134
-
135
-
136
-
137
-
138
-
139
-
140
-
141
-
142
-
143
-
144
-
145
-
146
-
147
-
148
-
149
-
150
-
151
-
152
-
153
-
154
-
155
-
156
-
157
-
158
-
159
-
160
-
161
-
162
-
163
-
164
-
165
-
166
-
167
-
168
-
169
-
170
-
171
-
172
-
173
-
174
-
175
-
176
-
177
-
178
-
179
-
180
-
181
-
182
-
183
-
184
-
185
-
186
-
187
-
188
-
189
-
190
-
191
-
192
-
193
-
194
-
195
-
196
-
197
-
198
-
199
-
200
-
201
-
202
-
203
-
204
-
205
-
206
-
207
-
208
-
209
-
210
-
211
-
212
-
213
-
214
-
215
-
216
-
217
-
218
-
219
-
220
-
221
-
222
-
223
-
224
-
225
-
226
-
227
-
228
-
229
-
230
-
231
-
232
-
233
-
234
-
235
-
236
-
237
-
238
-
239
-
240
-
241
-
242
-
243
-
244
-
245
-
246
-
247
-
248
-
249
-
 250
250 -
 251
251 -
 252
252 -
 253
253 -
 254
254 -
 255
255 -
 256
256 -
 257
257 -
 258
258 -
 259
259 -
 260
260 -
 261
261 -
 262
262 -
 263
263 -
 264
264 -
 265
265 -
 266
266 -
 267
267 -
 268
268 -
 269
269 -
 270
270 -
271
-
272
-
273
-
274
-
275
-
276
-
277
-
278
-
279
-
280
-
281
-
282
-
283
-
284
-
285
-
286
-
287
-
288
-
289
-
290
-
291
-
292
-
293
-
294
-
295
-
296
-
297
-
298
-
299
-
300
-
301
-
302
-
303
 |
 |

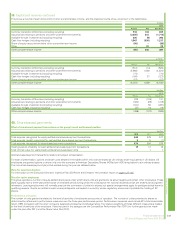
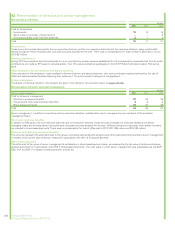
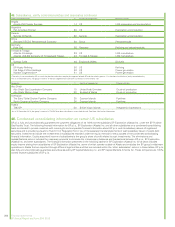
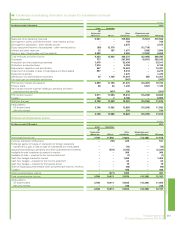
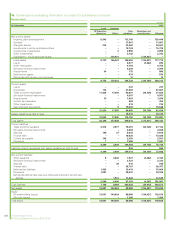
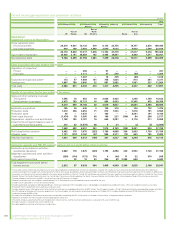
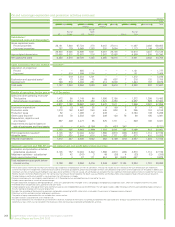
46. Condensed consolidating information on certain US subsidiaries continued
Income statement continued
$ million
For the year ended 31 December 2011
Issuer Guarantor
BP Exploration
(Alaska) Inc. BP p.l.c.
Other
subsidiaries
Eliminations and
reclassifications BP group
Sales and other operating revenues 6,159 – 375,517 (6,159) 375,517
Earnings from jointly controlled entities – after interest and tax – – 1,304 – 1,304
Earnings from associates – after interest and tax – – 4,916 – 4,916
Equity-accounted income of subsidiaries – after interest and tax 313 26,158 – (26,471) –
Interest and other revenues 10 242 664 (320) 596
Gains on sale of businesses and fixed assets – 1 4,129 – 4,130
Total revenues and other income 6,482 26,401 386,530 (32,950) 386,463
Purchases 978 – 290,799 (6,159) 285,618
Production and manufacturing expenses 1,280 – 22,865 – 24,145
Production and similar taxes 1,684 – 6,596 – 8,280
Depreciation, depletion and amortization 335 – 10,800 – 11,135
Impairment and losses on sale of businesses and fixed assets – – 2,058 – 2,058
Exploration expense 4 – 1,516 – 1,520
Distribution and administration expenses 27 1,048 12,992 (109) 13,958
Fair value gain on embedded derivatives – – (68) – (68)
Profit before interest and taxation 2,174 25,353 38,972 (26,682) 39,817
Finance costs 32 47 1,378 (211) 1,246
Net finance (income) expense relating to pensions and other
post-retirement benefits – (533) 270 – (263)
Profit before taxation 2,142 25,839 37,324 (26,471) 38,834
Taxation 729 139 11,869 – 12,737
Profit for the year 1,413 25,700 25,455 (26,471) 26,097
Attributable to
BP shareholders 1,413 25,700 25,058 (26,471) 25,700
Minority interest – – 397 – 397
1,413 25,700 25,455 (26,471) 26,097
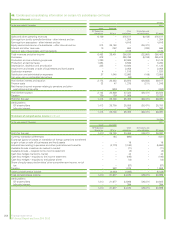
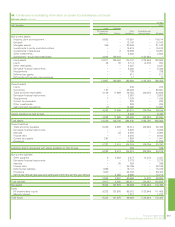
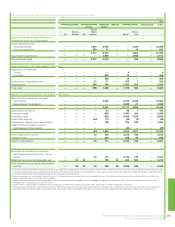
Statement of comprehensive income continued
$ million
For the year ended 31 December 2011
Issuer Guarantor
BP Exploration
(Alaska) Inc. BP p.l.c.
Other
subsidiaries
Eliminations and
reclassifications BP group
Profit for the year 1,413 25,700 25,455 (26,471) 26,097
Currency translation differences – 164 (695) – (531)
Exchange (gains) or losses on translation of foreign operations transferred
to gain or loss on sale of businesses and fixed assets – – 19 – 19
Actuarial loss relating to pensions and other post-retirement benefits – (4,770) (1,190) – (5,960)
Available-for-sale investments marked to market – – (71) – (71)
Available-for-sale – recycled to the income statement – – (3) – (3)
Cash flow hedges marked to market – – 44 – 44
Cash flow hedges – recycled to the income statement – – (195) – (195)
Cash flow hedges – recycled to the balance sheet – – (13) – (13)
Share of equity-accounted entities’ other comprehensive income, net of
tax – – (57) – (57)
Taxation – 583 1,076 – 1,659
Other comprehensive income – (4,023) (1,085) – (5,108)
Total comprehensive income 1,413 21,677 24,370 (26,471) 20,989
Attributable to
BP shareholders 1,413 21,677 23,986 (26,471) 20,605
Minority interest – – 384 – 384
1,413 21,677 24,370 (26,471) 20,989
258 Financial statements
BP Annual Report and Form 20-F 2012