BP 2012 Annual Report Download - page 271
Download and view the complete annual report
Please find page 271 of the 2012 BP annual report below. You can navigate through the pages in the report by either clicking on the pages listed below, or by using the keyword search tool below to find specific information within the annual report.-
 1
1 -
2
-
3
-
4
-
5
-
6
-
7
-
8
-
9
-
10
-
11
-
12
-
13
-
14
-
15
-
16
-
17
-
18
-
19
-
20
-
21
-
22
-
23
-
24
-
25
-
26
-
27
-
28
-
29
-
30
-
31
-
32
-
33
-
34
-
35
-
36
-
37
-
38
-
39
-
40
-
41
-
42
-
43
-
44
-
45
-
46
-
47
-
48
-
49
-
50
-
51
-
52
-
53
-
54
-
55
-
56
-
57
-
58
-
59
-
60
-
61
-
62
-
63
-
64
-
65
-
66
-
67
-
68
-
69
-
70
-
71
-
72
-
73
-
74
-
75
-
76
-
77
-
78
-
79
-
80
-
81
-
82
-
83
-
84
-
85
-
86
-
87
-
88
-
89
-
90
-
91
-
92
-
93
-
94
-
95
-
96
-
97
-
98
-
99
-
100
-
101
-
102
-
103
-
104
-
105
-
106
-
107
-
108
-
109
-
110
-
111
-
112
-
113
-
114
-
115
-
116
-
117
-
118
-
119
-
120
-
121
-
122
-
123
-
124
-
125
-
126
-
127
-
128
-
129
-
130
-
131
-
132
-
133
-
134
-
135
-
136
-
137
-
138
-
139
-
140
-
141
-
142
-
143
-
144
-
145
-
146
-
147
-
148
-
149
-
150
-
151
-
152
-
153
-
154
-
155
-
156
-
157
-
158
-
159
-
160
-
161
-
162
-
163
-
164
-
165
-
166
-
167
-
168
-
169
-
170
-
171
-
172
-
173
-
174
-
175
-
176
-
177
-
178
-
179
-
180
-
181
-
182
-
183
-
184
-
185
-
186
-
187
-
188
-
189
-
190
-
191
-
192
-
193
-
194
-
195
-
196
-
197
-
198
-
199
-
200
-
201
-
202
-
203
-
204
-
205
-
206
-
207
-
208
-
209
-
210
-
211
-
212
-
213
-
214
-
215
-
216
-
217
-
218
-
219
-
220
-
221
-
222
-
223
-
224
-
225
-
226
-
227
-
228
-
229
-
230
-
231
-
232
-
233
-
234
-
235
-
236
-
237
-
238
-
239
-
240
-
241
-
242
-
243
-
244
-
245
-
246
-
247
-
248
-
249
-
250
-
251
-
252
-
253
-
254
-
255
-
256
-
257
-
258
-
259
-
260
-
 261
261 -
 262
262 -
 263
263 -
 264
264 -
 265
265 -
 266
266 -
 267
267 -
 268
268 -
 269
269 -
 270
270 -
 271
271 -
 272
272 -
 273
273 -
 274
274 -
 275
275 -
 276
276 -
 277
277 -
 278
278 -
 279
279 -
 280
280 -
 281
281 -
282
-
283
-
284
-
285
-
286
-
287
-
288
-
289
-
290
-
291
-
292
-
293
-
294
-
295
-
296
-
297
-
298
-
299
-
300
-
301
-
302
-
303
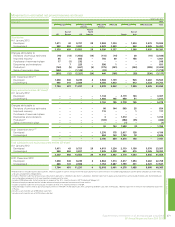
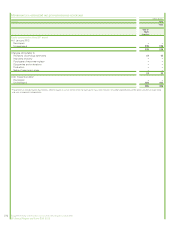
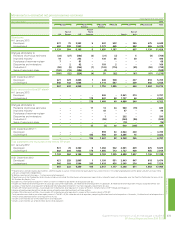
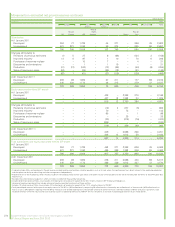
 |
 |

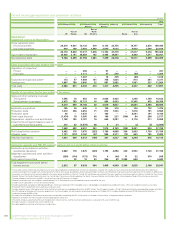
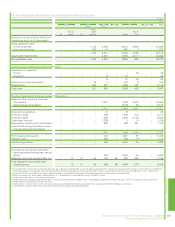
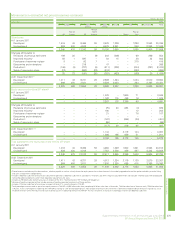
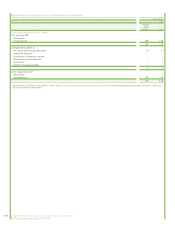
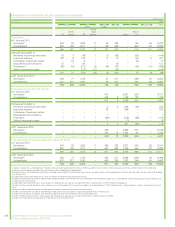
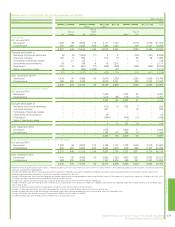
$ million
2010
Europe North
America
South
America
Africa Asia Australasia Total
UK
Rest of
Europe US
Rest of
North
AmericagRussia
Rest of
Asia
Equity-accounted entities (BP share)a
Capitalized costs at 31 Decemberb
Gross capitalized costs
Proved properties – – – 893 5,778 – 14,486 3,192 – 24,349
Unproved properties – – – 533 163 – 652 – – 1,348
– – – 1,426 5,941 – 15,138 3,192 – 25,697
Accumulated depreciation – – – – 2,250 – 6,300 2,674 – 11,224
Net capitalized costs – – – 1,426 3,691 – 8,838 518 – 14,473
Costs incurred for the year ended 31 Decemberb
Acquisition of propertiesc
Proved – – – – – – – – – –
Unproved – – – – 9 – 66 – – 75
– – – – 9 – 66 – – 75
Exploration and appraisal costsd– – – 28 2 – 94 – – 124
Development – – – 21 549 – 1,416 355 – 2,341
Total costs – – – 49 560 – 1,576 355 – 2,540
Results of operations for the year ended 31 December
Sales and other operating revenuese
Third parties – – – – 2,268 – 5,610 2,557 – 10,435
Sales between businesses – – – – – – 3,432 19 – 3,451
– – – – 2,268 – 9,042 2,576 – 13,886
Exploration expenditure – – – – 22 – 40 – – 62
Production costs – – – – 316 – 1,602 184 – 2,102
Production taxes – – – – 911 – 3,567 2,029 – 6,507
Other costs (income) – – – 67 75 – 3 (2) – 143
Depreciation, depletion and amortization – – – – 269 – 954 363 – 1,586
Impairments and losses on sale of
businesses and fixed assets – – – – – – 43 – – 43
– – – 67 1,593 – 6,209 2,574 – 10,443
Profit (loss) before taxation – – – (67) 675 – 2,833 2 – 3,443
Allocable taxes – – – – 260 – 475 33 – 768
Results of operations – – – (67) 415 – 2,358 (31) – 2,675
Exploration and production activities –
equity-accounted entities after tax
(as above) – – – (67) 415 – 2,358 (31) – 2,675
Midstream and other activities after taxf– 4 27 238 199 63 255 518 – 1,304
Total replacement cost profit after
interest and tax – 4 27 171 614 63 2,613 487 – 3,979
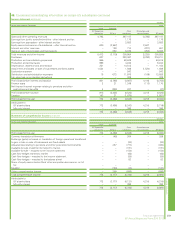
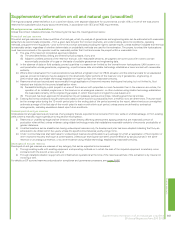
aThese tables contain information relating to oil and natural gas exploration and production activities of equity-accounted entities. They do not include amounts relating to assets held for sale. Midstream
activities relating to the management and ownership of crude oil and natural gas pipelines, processing and export terminals and LNG processing facilities and transportation as well as downstream
activities of TNK-BP are excluded. The amounts reported for equity-accounted entities exclude the corresponding amounts for their equity-accounted entities.
bDecommissioning assets are included in capitalized costs at 31 December but are excluded from costs incurred for the year.
cIncludes costs capitalized as a result of asset exchanges.
dIncludes exploration and appraisal drilling expenditures, which are capitalized within intangible assets, and geological and geophysical exploration costs, which are charged to income as incurred.
ePresented net of transportation costs and sales taxes.
fIncludes interest, minority interest and the net results of equity-accounted entities of equity-accounted entities.
gAn amendment has been made to the classification of costs between proved and unproved properties.
Supplementary information on oil and natural gas (unaudited) 269
BP Annual Report and Form 20-F 2012
Financial statements
Oil and natural gas exploration and production activities continued