BP 2012 Annual Report Download - page 36
Download and view the complete annual report
Please find page 36 of the 2012 BP annual report below. You can navigate through the pages in the report by either clicking on the pages listed below, or by using the keyword search tool below to find specific information within the annual report.-
 1
1 -
2
-
3
-
4
-
5
-
6
-
7
-
8
-
9
-
10
-
11
-
12
-
13
-
14
-
15
-
16
-
17
-
18
-
19
-
20
-
21
-
22
-
23
-
24
-
25
-
 26
26 -
 27
27 -
 28
28 -
 29
29 -
 30
30 -
 31
31 -
 32
32 -
 33
33 -
 34
34 -
 35
35 -
 36
36 -
 37
37 -
 38
38 -
 39
39 -
 40
40 -
 41
41 -
 42
42 -
 43
43 -
 44
44 -
 45
45 -
 46
46 -
47
-
48
-
49
-
50
-
51
-
52
-
53
-
54
-
55
-
56
-
57
-
58
-
59
-
60
-
61
-
62
-
63
-
64
-
65
-
66
-
67
-
68
-
69
-
70
-
71
-
72
-
73
-
74
-
75
-
76
-
77
-
78
-
79
-
80
-
81
-
82
-
83
-
84
-
85
-
86
-
87
-
88
-
89
-
90
-
91
-
92
-
93
-
94
-
95
-
96
-
97
-
98
-
99
-
100
-
101
-
102
-
103
-
104
-
105
-
106
-
107
-
108
-
109
-
110
-
111
-
112
-
113
-
114
-
115
-
116
-
117
-
118
-
119
-
120
-
121
-
122
-
123
-
124
-
125
-
126
-
127
-
128
-
129
-
130
-
131
-
132
-
133
-
134
-
135
-
136
-
137
-
138
-
139
-
140
-
141
-
142
-
143
-
144
-
145
-
146
-
147
-
148
-
149
-
150
-
151
-
152
-
153
-
154
-
155
-
156
-
157
-
158
-
159
-
160
-
161
-
162
-
163
-
164
-
165
-
166
-
167
-
168
-
169
-
170
-
171
-
172
-
173
-
174
-
175
-
176
-
177
-
178
-
179
-
180
-
181
-
182
-
183
-
184
-
185
-
186
-
187
-
188
-
189
-
190
-
191
-
192
-
193
-
194
-
195
-
196
-
197
-
198
-
199
-
200
-
201
-
202
-
203
-
204
-
205
-
206
-
207
-
208
-
209
-
210
-
211
-
212
-
213
-
214
-
215
-
216
-
217
-
218
-
219
-
220
-
221
-
222
-
223
-
224
-
225
-
226
-
227
-
228
-
229
-
230
-
231
-
232
-
233
-
234
-
235
-
236
-
237
-
238
-
239
-
240
-
241
-
242
-
243
-
244
-
245
-
246
-
247
-
248
-
249
-
250
-
251
-
252
-
253
-
254
-
255
-
256
-
257
-
258
-
259
-
260
-
261
-
262
-
263
-
264
-
265
-
266
-
267
-
268
-
269
-
270
-
271
-
272
-
273
-
274
-
275
-
276
-
277
-
278
-
279
-
280
-
281
-
282
-
283
-
284
-
285
-
286
-
287
-
288
-
289
-
290
-
291
-
292
-
293
-
294
-
295
-
296
-
297
-
298
-
299
-
300
-
301
-
302
-
303
 |
 |

Business review: BP in more depth
BP Annual Report and Form 20-F 2012
34
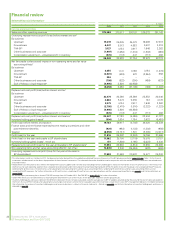
Financial review
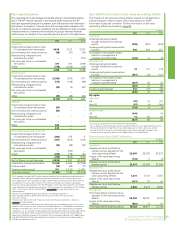
Selected financial informationa
$ million
2012 2011 2010 2009 2008
Income statement data
Sales and other operating revenues 375,580 375,517 297,107 239,272 361,143
Underlying replacement cost profit (loss) before interest and taxb
By business
Upstream 19,419 25,225 25,073 19,668 37,318
Downstream 6,447 6,013 4,883 3,607 3,318
TNK-BPc3,127 4,134 2,617 1,948 2,262
Other businesses and corporate (1,997) (1,656) (1,316) (1,833) (590)
Consolidation adjustment – unrealized profit in inventory (576) (113) 447 (717) 466
26,420 33,603 31,704 22,673 42,774
Net favourable (unfavourable) impact of non-operating items and fair value
accounting effectsb
By business
Upstream 3,055 1,141 3,196 3,184 (1,272)
Downstream (3,601) (539) 672 (2,864) 858
TNK-BP 246 – – – –
Other businesses and corporate (798) (822) (200) (489) (633)
Gulf of Mexico oil spill responsed(4,995) 3,800 (40,858) – –
(6,093) 3,580 (37,190) (169) (1,047)
Replacement cost profit (loss) before interest and taxb
By business
Upstream 22,474 26,366 28,269 22,852 36,046
Downstream 2,846 5,474 5,555 743 4,176
TNK-BPc3,373 4,134 2,617 1,948 2,262
Other businesses and corporate (2,795) (2,478) (1,516) (2,322) (1,223)
Gulf of Mexico oil spill responsed(4,995) 3,800 (40,858) – –
Consolidation adjustment – unrealized profit in inventory (576) (113) 447 (717) 466
Replacement cost profit (loss) before interest and taxationb20,327 37,183 (5,486) 22,504 41,727
Inventory holding gains (losses)e(594) 2,634 1,784 3,922
(6,488)
Profit (loss) before interest and taxation 19,733 39,817 (3,702) 26,426 35,239
Finance costs and net finance expense/income relating to pensions and other
post-retirement benefits (924) (983) (1,123) (1,302) (956)
Taxation (6,993) (12,737) 1,501 (8,365) (12,617)
Profit (loss) for the year 11,816 26,097 (3,324) 16,759 21,666
Profit (loss) for the year attributable to BP shareholders 11,582 25,700 (3,719) 16,578 21,157
Inventory holding (gains) lossese, net of tax 411 (1,800) (1,195) (2,623) 4,436
Replacement cost profit (loss) for the year attributable to BP shareholdersb11,993 23,900 (4,914) 13,955 25,593
Non-operating items and fair value accounting effectsb, net of tax (5,645) 2,242 (25,436) (622) (650)
Underlying replacement cost profit (loss) for the year attributable to
BP shareholdersb17,638 21,658 20,522 14,577 26,243
a This information, insofar as it relates to 2012, has been extracted or derived from the audited consolidated financial statements of the BP group presented on pages 177-262. Note 1 to the financial
statements includes details on the basis of preparation of these financial statements. The selected information should be read in conjunction with the audited financial statements and related notes
elsewhere herein.
b Replacement cost (RC) profit or loss reflects the replacement cost of supplies and is arrived at by excluding inventory holding gains and losses from profit or loss. RC profit or loss is the measure of
profit or loss for each operating segment that is required to be disclosed under International Financial Reporting Standards (IFRS). RC profit or loss for the group is not a recognized GAAP measure.
Underlying RC profit or loss is RC profit or loss after adjusting for non-operating items and fair value accounting effects. Underlying RC profit or loss and fair value accounting effects are not
recognized GAAP measures. For further information on RC profit or loss, underlying RC profit or loss, non-operating items and fair value accounting effects, see page 37 and Certain definitions on
pages 98-99.
c BP ceased equity accounting for its share of TNK-BP earnings from 22 October 2012. See TNK-BP on pages 80-81 for further information.
d Under IFRS these costs are presented as a reconciling item between the sum of the results of the reportable segments and the group results.
e Inventory holding gains and losses represent the difference between the cost of sales calculated using the average cost to BP of supplies acquired during the year and the cost of sales calculated on
the first-in first-out (FIFO) method, after adjusting for any changes in provisions where the net realizable value of the inventory is lower than its cost. BP’s management believes it is helpful to disclose
this information. An analysis of inventory holding gains and losses by business is shown in Financial statements – Note 6 on page 203 and further information on inventory holding gains and losses is
provided on page 98.