Ameriprise 2013 Annual Report Download - page 2
Download and view the complete annual report
Please find page 2 of the 2013 Ameriprise annual report below. You can navigate through the pages in the report by either clicking on the pages listed below, or by using the keyword search tool below to find specific information within the annual report.-
 1
1 -
 2
2 -
 3
3 -
 4
4 -
 5
5 -
 6
6 -
 7
7 -
 8
8 -
 9
9 -
 10
10 -
 11
11 -
 12
12 -
 13
13 -
14
-
15
-
16
-
17
-
18
-
19
-
20
-
21
-
22
-
23
-
24
-
25
-
26
-
27
-
28
-
29
-
30
-
31
-
32
-
33
-
34
-
35
-
36
-
37
-
38
-
39
-
40
-
41
-
42
-
43
-
44
-
45
-
46
-
47
-
48
-
49
-
50
-
51
-
52
-
53
-
54
-
55
-
56
-
57
-
58
-
59
-
60
-
61
-
62
-
63
-
64
-
65
-
66
-
67
-
68
-
69
-
70
-
71
-
72
-
73
-
74
-
75
-
76
-
77
-
78
-
79
-
80
-
81
-
82
-
83
-
84
-
85
-
86
-
87
-
88
-
89
-
90
-
91
-
92
-
93
-
94
-
95
-
96
-
97
-
98
-
99
-
100
-
101
-
102
-
103
-
104
-
105
-
106
-
107
-
108
-
109
-
110
-
111
-
112
-
113
-
114
-
115
-
116
-
117
-
118
-
119
-
120
-
121
-
122
-
123
-
124
-
125
-
126
-
127
-
128
-
129
-
130
-
131
-
132
-
133
-
134
-
135
-
136
-
137
-
138
-
139
-
140
-
141
-
142
-
143
-
144
-
145
-
146
-
147
-
148
-
149
-
150
-
151
-
152
-
153
-
154
-
155
-
156
-
157
-
158
-
159
-
160
-
161
-
162
-
163
-
164
-
165
-
166
-
167
-
168
-
169
-
170
-
171
-
172
-
173
-
174
-
175
-
176
-
177
-
178
-
179
-
180
-
181
-
182
-
183
-
184
-
185
-
186
-
187
-
188
-
189
-
190
-
191
-
192
-
193
-
194
-
195
-
196
-
197
-
198
-
199
-
200
-
201
-
202
-
203
-
204
-
205
-
206
-
207
-
208
-
209
-
210
-
211
-
212
 |
 |

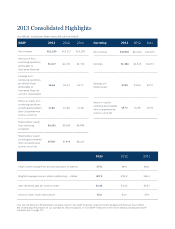
This Annual Report to Shareholders contains certain non-GAAP nancial measures that management believes best reect
the underlying performance of our operations. Reconciliations of non-GAAP measures to the most directly comparable GAAP
measure are on page 12.
2013 Consolidated Highlights
(in millions, except per share amounts and as noted)
GAAP 2013 2012 2011 Operating 2013 2012 2011
Net revenues $11,199 $10,217 $10,192 Net revenues $10,857 $10,143 $10,050
Net income from
continuing operations
attributable to
Ameriprise Financial
$1,337 $1,031 $1,176 Earnings $1,460 $1,245 $1,274
Earnings from
continuing operations
per diluted share
attributable to
Ameriprise Financial
common shareholders
$6.46 $4.63 $4.77 Earnings per
diluted share $7.05 $5.59 $5.17
Return on equity from
continuing operations
excluding accumulated
other comprehensive
income, net of tax
17.2% 12.8% 13.9%
Return on equity
excluding accumulated
other comprehensive
income, net of tax
19.7% 16.2% 16.0%
Shareholders’ equity
from continuing
operations
$8,192 $9,092 $8,988
Shareholders’ equity
excluding accumulated
other comprehensive
income, net of tax
$7,597 $7,898 $8,237
2013 2012 2011
Assets under management and administration (in billions) $771 $681 $631
Weighted average common shares outstanding — diluted 207.1 222.8 246.3
Cash dividends paid per common share $2.01 $1.43 $0.87
Common stock shares repurchased 17.8 24.6 27.9