Ameriprise 2013 Annual Report Download - page 10
Download and view the complete annual report
Please find page 10 of the 2013 Ameriprise annual report below. You can navigate through the pages in the report by either clicking on the pages listed below, or by using the keyword search tool below to find specific information within the annual report.-
 1
1 -
 2
2 -
 3
3 -
 4
4 -
 5
5 -
 6
6 -
 7
7 -
 8
8 -
 9
9 -
 10
10 -
 11
11 -
 12
12 -
 13
13 -
 14
14 -
 15
15 -
 16
16 -
 17
17 -
 18
18 -
 19
19 -
 20
20 -
 21
21 -
22
-
23
-
24
-
25
-
26
-
27
-
28
-
29
-
30
-
31
-
32
-
33
-
34
-
35
-
36
-
37
-
38
-
39
-
40
-
41
-
42
-
43
-
44
-
45
-
46
-
47
-
48
-
49
-
50
-
51
-
52
-
53
-
54
-
55
-
56
-
57
-
58
-
59
-
60
-
61
-
62
-
63
-
64
-
65
-
66
-
67
-
68
-
69
-
70
-
71
-
72
-
73
-
74
-
75
-
76
-
77
-
78
-
79
-
80
-
81
-
82
-
83
-
84
-
85
-
86
-
87
-
88
-
89
-
90
-
91
-
92
-
93
-
94
-
95
-
96
-
97
-
98
-
99
-
100
-
101
-
102
-
103
-
104
-
105
-
106
-
107
-
108
-
109
-
110
-
111
-
112
-
113
-
114
-
115
-
116
-
117
-
118
-
119
-
120
-
121
-
122
-
123
-
124
-
125
-
126
-
127
-
128
-
129
-
130
-
131
-
132
-
133
-
134
-
135
-
136
-
137
-
138
-
139
-
140
-
141
-
142
-
143
-
144
-
145
-
146
-
147
-
148
-
149
-
150
-
151
-
152
-
153
-
154
-
155
-
156
-
157
-
158
-
159
-
160
-
161
-
162
-
163
-
164
-
165
-
166
-
167
-
168
-
169
-
170
-
171
-
172
-
173
-
174
-
175
-
176
-
177
-
178
-
179
-
180
-
181
-
182
-
183
-
184
-
185
-
186
-
187
-
188
-
189
-
190
-
191
-
192
-
193
-
194
-
195
-
196
-
197
-
198
-
199
-
200
-
201
-
202
-
203
-
204
-
205
-
206
-
207
-
208
-
209
-
210
-
211
-
212
 |
 |

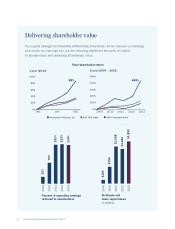
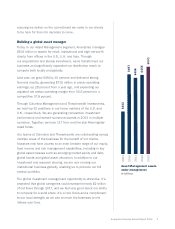
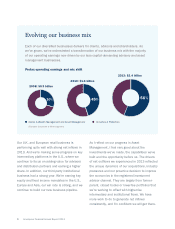
Evolving our business mix
Each of our diversied businesses delivers for clients, advisors and shareholders. As
we’ve grown, we’ve orchestrated a transformation of our business mix with the majority
of our operating earnings now driven by our less capital-demanding advisory and asset
management businesses.
Pretax operating earnings and mix shift
Advice & Wealth Management and Asset Management Annuities & Protection
(Excludes Corporate & Other segment)
30%
2008: $0.9 billion
2010: $1.6 billion
45%
2013: $2.4 billion
56%
8 Ameriprise Financial Annual Report 2013
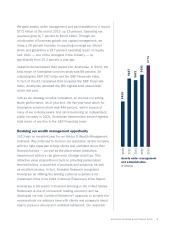
Our U.K. and European retail business is
performing quite well with strong net inows in
2013. And we’re making some progress on key
intermediary platforms in the U.S., where we
continue to focus on adding value for advisors
and distribution partners and earning a higher
share. In addition, our third-party institutional
business had a strong year. We’re earning key
equity and xed income mandates in the U.S.,
Europe and Asia, our win rate is strong, and we
continue to build our new business pipeline.
As I reect on our progress in Asset
Management, I feel very good about the
investments we’ve made, the capabilities we’ve
built and the opportunity before us. The drivers
of net outows we experienced in 2013 reected
the unique dynamics of our acquisitions, industry
pressures and our proactive decision to improve
the economics in the registered investment
advisor channel. They are largely from former-
parent, closed books or lower-fee portfolios that
we’re working to offset with higher-fee
intermediary and institutional ows. We have
more work to do to generate net inows
consistently, and I’m condent we will get there.