Ameriprise 2013 Annual Report Download - page 11
Download and view the complete annual report
Please find page 11 of the 2013 Ameriprise annual report below. You can navigate through the pages in the report by either clicking on the pages listed below, or by using the keyword search tool below to find specific information within the annual report.-
 1
1 -
 2
2 -
 3
3 -
 4
4 -
 5
5 -
 6
6 -
 7
7 -
 8
8 -
 9
9 -
 10
10 -
 11
11 -
 12
12 -
 13
13 -
 14
14 -
 15
15 -
 16
16 -
 17
17 -
 18
18 -
 19
19 -
 20
20 -
 21
21 -
 22
22 -
23
-
24
-
25
-
26
-
27
-
28
-
29
-
30
-
31
-
32
-
33
-
34
-
35
-
36
-
37
-
38
-
39
-
40
-
41
-
42
-
43
-
44
-
45
-
46
-
47
-
48
-
49
-
50
-
51
-
52
-
53
-
54
-
55
-
56
-
57
-
58
-
59
-
60
-
61
-
62
-
63
-
64
-
65
-
66
-
67
-
68
-
69
-
70
-
71
-
72
-
73
-
74
-
75
-
76
-
77
-
78
-
79
-
80
-
81
-
82
-
83
-
84
-
85
-
86
-
87
-
88
-
89
-
90
-
91
-
92
-
93
-
94
-
95
-
96
-
97
-
98
-
99
-
100
-
101
-
102
-
103
-
104
-
105
-
106
-
107
-
108
-
109
-
110
-
111
-
112
-
113
-
114
-
115
-
116
-
117
-
118
-
119
-
120
-
121
-
122
-
123
-
124
-
125
-
126
-
127
-
128
-
129
-
130
-
131
-
132
-
133
-
134
-
135
-
136
-
137
-
138
-
139
-
140
-
141
-
142
-
143
-
144
-
145
-
146
-
147
-
148
-
149
-
150
-
151
-
152
-
153
-
154
-
155
-
156
-
157
-
158
-
159
-
160
-
161
-
162
-
163
-
164
-
165
-
166
-
167
-
168
-
169
-
170
-
171
-
172
-
173
-
174
-
175
-
176
-
177
-
178
-
179
-
180
-
181
-
182
-
183
-
184
-
185
-
186
-
187
-
188
-
189
-
190
-
191
-
192
-
193
-
194
-
195
-
196
-
197
-
198
-
199
-
200
-
201
-
202
-
203
-
204
-
205
-
206
-
207
-
208
-
209
-
210
-
211
-
212
 |
 |

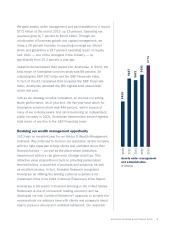
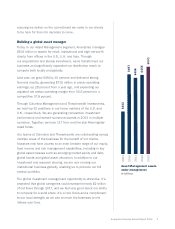
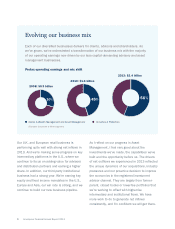
Evolving our business mix and deploying capital
As we grow our earnings over time, I believe we can consistently
generate more than 60 percent of our operating earnings from
Advice & Wealth Management and Asset Management while
prudently growing our Annuity and Protection businesses.
In 2008, 30 percent of our operating earnings came from our
higher P/E, less capital-demanding businesses. That number grew
to 45 percent in 2010, and last year, we raised it to 56 percent.
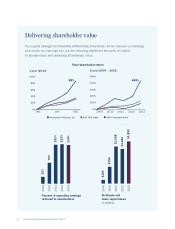
Our mix of businesses generates signicant free cash ow that
we use to invest and return to shareholders. And as we free
up capital, we are returning a large percentage through share
repurchases and dividends. Last year we devoted nearly $2 billion
to share repurchases and dividends, including raising our regular
quarterly dividend 16 percent, which represented the sixth
increase since 2010. In fact, 2013 marked the third consecutive
year we returned more of our capital to shareholders than we
earned while continuing to hold appropriate excess capital and
maintain our strong ratings.
Serving our communities and earning a strong reputation
At Ameriprise, our business is a relationship business, and our
clients are served by some of the most talented and committed
individuals in the industry. I feel very good about our people and
the values they demonstrate. We consistently achieve some of the
highest scores for employee engagement in the industry and our
advisor engagement and satisfaction are near record highs.
Our terric engagement is also reected in our giving programs
and volunteerism, including our national partnership with Feeding
America. Ameriprise and our employees, advisors and clients are
making a difference. More than 10,000 people in the United
States, including our clients, participated in the Ameriprise
Financial National Day of Service. We’re also being recognized for
the work we do and for our community involvement. Ameriprise
was recognized again as a member of The Civic 50 — a list of
the top civic-minded companies.
Ameriprise Financial Annual Report 2013 9
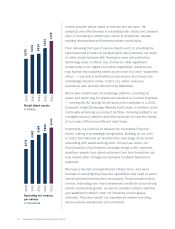
Operating return on
equity, excl. AOCI
2009
2010
2011
2012
2013
Operating earnings
per diluted share
2009
2010
2011
2012
2013
10.7%
13.7%
16.0%
16.2%
19.7% $7.05
$5.59
$5.17
$4.10
$2.95