Albertsons 2010 Annual Report Download - page 2
Download and view the complete annual report
Please find page 2 of the 2010 Albertsons annual report below. You can navigate through the pages in the report by either clicking on the pages listed below, or by using the keyword search tool below to find specific information within the annual report.-
 1
1 -
 2
2 -
 3
3 -
 4
4 -
 5
5 -
 6
6 -
 7
7 -
 8
8 -
 9
9 -
 10
10 -
 11
11 -
 12
12 -
 13
13 -
14
-
15
-
16
-
17
-
18
-
19
-
20
-
21
-
22
-
23
-
24
-
25
-
26
-
27
-
28
-
29
-
30
-
31
-
32
-
33
-
34
-
35
-
36
-
37
-
38
-
39
-
40
-
41
-
42
-
43
-
44
-
45
-
46
-
47
-
48
-
49
-
50
-
51
-
52
-
53
-
54
-
55
-
56
-
57
-
58
-
59
-
60
-
61
-
62
-
63
-
64
-
65
-
66
-
67
-
68
-
69
-
70
-
71
-
72
-
73
-
74
-
75
-
76
-
77
-
78
-
79
-
80
-
81
-
82
-
83
-
84
-
85
-
86
-
87
-
88
-
89
-
90
-
91
-
92
-
93
-
94
-
95
-
96
-
97
-
98
-
99
-
100
-
101
-
102
 |
 |

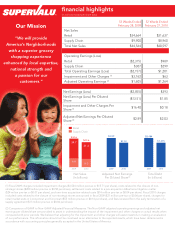
Net Sales
(In billions)
Adjusted Net Earnings
Per Diluted Share(2)
2010
$40.6
9.0
31.6
2009
$44.6
9.9
34.7
2009
$2.89
2010
$2.03
Total Debt
(In billions)
2009
$8.484
2010
$7.635
Retail
Supply Chain
53 Weeks Ended
February 28, 2009
52 Weeks Ended
February 27, 2010
Net Sa
l
es
Retail $34,664 $31,637
Supply Chain $9,900 $8,960
Total Net
S
ales $44
,
564 $40
,
597
Operating Earnings
(
Loss
)
R
eta
i
l
($
2,315
)
$
989
Suppl
y
Chain $307 $299
Tota
l
Operating Earnings (Loss)
($
2,157
)
$
1
,
201
Impairment an
d
Ot
h
er C
h
ar
g
es
(
1
)
$
3,762
$
63
Adjusted Operating Earnings
(
2
)
$
1
,
605
$
1
,
264
N
et Earnings
(
Loss
)
($
2,855
)
$
393
N
et Earnin
g
s (Loss) Per Di
l
ute
d
Sh
are ($13.51
)
$1.85
I
mpairment and Other Char
g
es Per
Sh
ar
e
(
1
)
$
16.40
$
0.18
A
d
juste
d
Net Earnings Per Di
l
ute
d
S
hare
(
2
)
$
2.89
$
2.03
(1) Fiscal 2009 charges included impairment charges ($3,524 million pre-tax or $15.71 per share), costs related to the closure of non-
strategic stores ($200 million pre-tax or $0.58 per share), settlement costs related to a pre-acquisition Albertsons litigation matter
($24 milion pre-tax or $0.07 per share), and one-time acquisition-related costs ($14 million pre-tax or $0.04 per share). Fiscal 2010 charges
included costs related to the closure of non-strategic stores announced in fiscal 2009 ($21 million pre-tax or $0.06 per share), charges for
retail market exits in Connecticut and Cincinnati ($55 million pre-tax or $0.16 per share), and fees received from the early termination of a
supply agreement ($13 million pre-tax or $0.04 per share).
(2) Comparison of GAAP to Non-GAAP Adjusted Financial Measures. The Non-GAAP adjusted operating earnings and adjusted net
earnings per diluted share are provided to assist in understanding the impact of the impairment and other charges on actual results when
compared with prior periods. We believe that adjusting for the impairment and other charges will assist investors in making an evaluation
of our performance. This information should not be construed as an alternative to the reported results, which have been determined in
accordance with accounting principles generally accepted in the United States of America.
financial highlights
(In millions except per share data)
Our Mission
“We will provide
America’s Neighborhoods
with a superior grocery
shopping experience
enhanced by local expertise,
national strength and
a passion for our
customers.”