Aetna 2006 Annual Report Download - page 9
Download and view the complete annual report
Please find page 9 of the 2006 Aetna annual report below. You can navigate through the pages in the report by either clicking on the pages listed below, or by using the keyword search tool below to find specific information within the annual report.-
 1
1 -
 2
2 -
 3
3 -
 4
4 -
 5
5 -
 6
6 -
 7
7 -
 8
8 -
 9
9 -
 10
10 -
 11
11 -
 12
12 -
 13
13 -
 14
14 -
 15
15 -
 16
16 -
 17
17 -
 18
18 -
 19
19 -
 20
20 -
21
-
22
-
23
-
24
-
25
-
26
-
27
-
28
-
29
-
30
-
31
-
32
-
33
-
34
-
35
-
36
-
37
-
38
-
39
-
40
-
41
-
42
-
43
-
44
-
45
-
46
-
47
-
48
-
49
-
50
-
51
-
52
-
53
-
54
-
55
-
56
-
57
-
58
-
59
-
60
-
61
-
62
-
63
-
64
-
65
-
66
-
67
-
68
-
69
-
70
-
71
-
72
-
73
-
74
-
75
-
76
-
77
-
78
-
79
-
80
-
81
-
82
-
83
-
84
-
85
-
86
-
87
-
88
-
89
-
90
-
91
-
92
-
93
-
94
-
95
-
96
-
97
-
98
-
99
-
100
-
101
-
102
 |
 |
Page 7
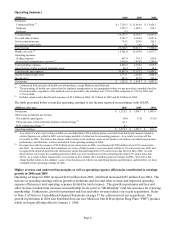
We became more efficient based on our operating expenses as a percentage of revenue. However, total operating
expenses increased in 2006 and 2005 primarily due to expenses related to the growth in our membership. Total
operating expenses increased due to higher selling expenses (reflecting an increase in commissionable premiums
from membership growth) and increases in general and administrative expenses due to higher employee related
costs, outside services and other expenses associated with higher membership. Total operating expenses in 2006
also reflect a $27 million pretax severance charge as well as the write off of an insurance recoverable and a net
charge related to our 2006 debt issuance noted above. Furthermore, operating expenses in 2005 increased due to
enrollment and marketing costs for the new PDP and operating expenses related to our 2005 acquisitions.
Underwriting margins (premiums less health care costs) increased in 2005 and to a lesser extent in 2006, reflecting
growth in premiums (as discussed above) partially offset by higher health care costs. Our underwriting margin for
2005 also reflects the release of approximately $103 million pretax of reserves related to the New York Market
Stabilization Pool (discussed below). Our medical cost ratios and reserve development are discussed in the
Commercial Risk and Medicare results below.
Our Commercial Risk products continued to grow in 2006 and 2005
Commercial Risk premiums increased approximately $1.4 billion in 2006 compared to 2005, and increased
approximately $2.0 billion in 2005 compared to 2004. The increase in 2006 reflects premium rate increases on
renewing business, and the increase in 2005 reflects increases in membership levels (refer to Membership
beginning on page 9) and increases in premium rates on renewing business.
Our Commercial Risk medical cost ratio (health care costs divided by premiums) was 79.3% for 2006, 76.9% for
2005 and 77.8% for 2004. Commercial Risk health care costs for 2006, 2005 and 2004 reflect favorable
development of prior period health care cost estimates, on a pretax basis, of approximately $16 million, $233
million (including approximately $103 million related to the release of reserves related to the New York Market
Stabilization Pool, discussed below), and $78 million, respectively. The favorable development of prior period
health care cost estimates recognized in each of these three years primarily relates to health care costs incurred in
the preceding year. In 2006, this was primarily the result of lower than expected health care cost trends (the rate of
increase in per member health care costs). In 2005 and 2004, the favorable development of prior period health care
cost estimates was primarily a result of the actual claim submission time being shorter than we anticipated and
lower than expected health care cost trends. As a result of the acceleration in claim submission time in 2005 and
2004, the volume of claims incurred but not reported was estimated to be higher than we actually experienced.
Also, our health care cost trend rate in 2005 and 2004 was lower than we anticipated in determining our health care
costs payable at December 31 of each of the preceding years. These factors resulted in the favorable development
of prior period health care estimates recognized in results of operations in 2006, 2005 and 2004. The calculation of
Health Care Costs Payable is a critical accounting estimate (refer to Critical Accounting Estimates – Health Care
Costs Payable beginning on page 21 for additional information).
In March 2005, we entered into an agreement with certain other carriers and the New York State Insurance
Department as to our participation in the New York State Market Stabilization Pool under New York Regulation
146 (“Regulation 146”) for the years 1999 through 2004. Regulation 146 requires all carriers with small group
and/or individual business in New York State to participate in a market stabilization pooling mechanism under
which carriers that experience higher than average cost factors in providing services to members with specified
medical conditions receive payments from the pool, and carriers that experience lower than average cost factors
make payments to the pool. From 1999 through 2004, in the absence of any pool data regarding relative average
cost factors of the carriers doing business in New York State, we made provisions for our estimate of liabilities
incurred in this pool based on discussions with the New York State Insurance Department and historical experience.
As of December 31, 2004 we had recorded reserves (included in health care costs payable) of approximately $89
million based on these estimates.