Aetna 2006 Annual Report Download - page 11
Download and view the complete annual report
Please find page 11 of the 2006 Aetna annual report below. You can navigate through the pages in the report by either clicking on the pages listed below, or by using the keyword search tool below to find specific information within the annual report.-
 1
1 -
 2
2 -
 3
3 -
 4
4 -
 5
5 -
 6
6 -
 7
7 -
 8
8 -
 9
9 -
 10
10 -
 11
11 -
 12
12 -
 13
13 -
 14
14 -
 15
15 -
 16
16 -
 17
17 -
 18
18 -
 19
19 -
 20
20 -
 21
21 -
 22
22 -
23
-
24
-
25
-
26
-
27
-
28
-
29
-
30
-
31
-
32
-
33
-
34
-
35
-
36
-
37
-
38
-
39
-
40
-
41
-
42
-
43
-
44
-
45
-
46
-
47
-
48
-
49
-
50
-
51
-
52
-
53
-
54
-
55
-
56
-
57
-
58
-
59
-
60
-
61
-
62
-
63
-
64
-
65
-
66
-
67
-
68
-
69
-
70
-
71
-
72
-
73
-
74
-
75
-
76
-
77
-
78
-
79
-
80
-
81
-
82
-
83
-
84
-
85
-
86
-
87
-
88
-
89
-
90
-
91
-
92
-
93
-
94
-
95
-
96
-
97
-
98
-
99
-
100
-
101
-
102
 |
 |

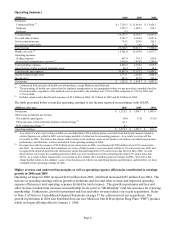
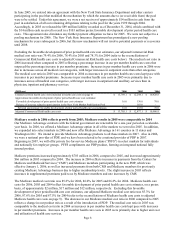
(Millions) 2006 2005 2004
Medicare health care costs (included in health care costs on page 6) 1,523.5$ 863.9$ 809.0$
Approximate favorable development of prior period health care cost estimates 2.0 17.0 12.0
Adjusted Medicare health care costs 1,525.5$ 880.9$ 821.0$
Other Sources of Revenue
Fees and other revenue for 2006 increased $358 million compared to 2005, reflecting ASC membership growth
(refer to Membership below), ASC rate increases and other revenue from our recent acquisitions. Fees and other
revenue for 2005 increased $334 million compared to 2004, reflecting ASC membership growth (refer to
Membership below), ASC rate increases, sales of add-on services and other revenue from our recent acquisitions.
Net investment income for 2006 increased $39 million compared to 2005, primarily reflecting higher average yields
in our portfolio of debt securities. Net investment income for 2005 increased $33 million compared to 2004,
reflecting higher average yields in our investment portfolio and higher mortgage loan prepayment fees.
Net realized capital gains of $9 million for 2006 were due primarily to gains from derivatives (refer to Risk
Management and Market-Sensitive Instruments on page 17 for a discussion of our use of derivatives). Net realized
capital gains of $11 million for 2005 were due primarily to real estate gains and gains on sales of debt securities in a
low interest rate environment and recoveries from investments previously written-down. Net realized capital gains
of $24 million for 2004 were due primarily to gains on sales of debt securities in a low interest rate environment
partially offset by losses from the write-down of other invested assets.
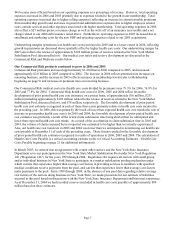
Membership
Health Care’ s membership as of December 31, 2006 and 2005 was as follows:
(Thousands) Risk ASC Total Risk ASC Total
Medical:
Commercial 5,088 10,053 15,141 5,115 9,406 14,521
Medicare Advantage 123 - 123 101 - 101
Medicare Health Support Program
(1)
- 17 17 - 19 19
Medicaid 22 130 152 - 114 114
Total Medical Membership 5,233 10,200 15,433 5,216 9,539 14,755
Consumer-Directed Health Plans
(2)
676 453
Dental 5,057 8,415 13,472 5,078 8,020 13,098
Pharmacy:
Commercial 9,161 8,885
Medicare PDP (stand-alone) 314 -
Medicare Advantage PDP 115 -
Total Pharmacy Benefit Management Services 9,590 8,885
Mail Order
(3)
625 560
Total Pharmacy 10,215 9,445
2006 2005
(1) Represents members who participate in a CMS pilot program under which we provide disease and case management services to
selected Medicare fee-for-service beneficiaries in exchange for a fee.
(2) Represents members in consumer-directed health plans included in Commercial medical membership above.
(3) Represents members who purchased medications through our mail order pharmacy operations during the fourth quarter of 2006 and
2005, respectively, and are included in pharmacy membership above.
Page 9