Aetna 2006 Annual Report Download - page 4
Download and view the complete annual report
Please find page 4 of the 2006 Aetna annual report below. You can navigate through the pages in the report by either clicking on the pages listed below, or by using the keyword search tool below to find specific information within the annual report.-
 1
1 -
 2
2 -
 3
3 -
 4
4 -
 5
5 -
 6
6 -
 7
7 -
 8
8 -
 9
9 -
 10
10 -
 11
11 -
 12
12 -
 13
13 -
 14
14 -
 15
15 -
16
-
17
-
18
-
19
-
20
-
21
-
22
-
23
-
24
-
25
-
26
-
27
-
28
-
29
-
30
-
31
-
32
-
33
-
34
-
35
-
36
-
37
-
38
-
39
-
40
-
41
-
42
-
43
-
44
-
45
-
46
-
47
-
48
-
49
-
50
-
51
-
52
-
53
-
54
-
55
-
56
-
57
-
58
-
59
-
60
-
61
-
62
-
63
-
64
-
65
-
66
-
67
-
68
-
69
-
70
-
71
-
72
-
73
-
74
-
75
-
76
-
77
-
78
-
79
-
80
-
81
-
82
-
83
-
84
-
85
-
86
-
87
-
88
-
89
-
90
-
91
-
92
-
93
-
94
-
95
-
96
-
97
-
98
-
99
-
100
-
101
-
102
 |
 |

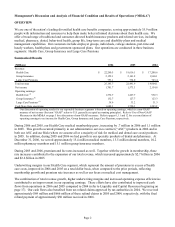
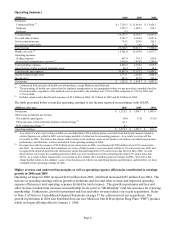
Management’s Discussion and Analysis of Financial Condition and Results of Operations (“MD&A”)
OVERVIEW
We are one of the nation’ s leading diversified health care benefits companies, serving approximately 35.9 million
people with information and resources to help them make better informed decisions about their health care. We
offer a broad range of traditional and consumer-directed health insurance products and related services, including
medical, pharmacy, dental, behavioral health, group life, long-term care and disability plans and medical
management capabilities. Our customers include employer groups, individuals, college students, part-time and
hourly workers, health plans and government-sponsored plans. Our operations are conducted in three business
segments: Health Care, Group Insurance and Large Case Pensions.
Summarized Results
(Millions) 2006 2005 2004
Revenue:
Health Care 22,240.5$ 19,616.1$ 17,200.6$
Group Insurance 2,152.1 2,141.8 1,960.1
Large Case Pensions 753.1 734.0 743.4
Total revenue 25,145.7 22,491.9 19,904.1
Net income 1,701.7 1,573.3 2,154.8
Operating earnings:
Health Care
(1)
1,572.7 1,427.7 992.3
Group Insurance
(1)
132.7 127.7 123.3
Large Case Pensions
(1)
38.9 33.2 31.3
Cash flows from operations 1,688.3 1,720.3 1,283.9
(1) Our discussion of operating results for our reportable business segments is based on operating earnings, which is a non-GAAP
measure of net income (the term “GAAP” refers to U.S. generally accepted accounting principles). Refer to Use of Non-GAAP
Measures in this MD&A on page 5 for a discussion of non-GAAP measures. Refer to pages 6, 11 and 12 for a reconciliation of
operating earnings to net income for Health Care, Group Insurance and Large Case Pensions, respectively.
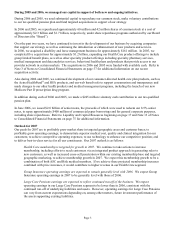
During 2006 and 2005, our Health Care medical membership grew, increasing by .7 million in 2006 and 1.1 million
in 2005. This growth occurred primarily in our administrative services contract (“ASC”) products in 2006 and in
both our ASC and our Risk (where we assume all or a majority of risk for medical and dental care costs) products
in 2005. In addition, during 2005 and 2006 we had growth in our specialty products of dental and pharmacy. At
December 31, 2006, we served approximately 15.4 million medical members, 13.5 million dental members, 10.2
million pharmacy members and 15.1 million group insurance members.
During 2005 and 2006, premium and fee rates increased as well. Together with the growth in membership, these
rate increases contributed to the expansion of our total revenue, which increased approximately $2.7 billion in 2006
and $2.6 billion in 2005.
Underwriting margins in our Health Care segment, which represent the amount of premiums in excess of health
care costs, improved in 2006 and 2005 on a total dollar basis, when compared to the prior periods, reflecting
membership growth and premium rate increases as well as our focus on medical cost management.
The combination of total revenue growth, higher underwriting margins and increased operating expense efficiencies
contributed to an improvement in our operating earnings. These efforts have also contributed to improved cash
flows from operations in 2006 and 2005 compared to 2004 (refer to Liquidity and Capital Resources beginning on
page 17). Our cash flows also benefited from tax refund claims approved by tax authorities in 2004. We received
approximately $69 million and $666 million of these refund claims in 2005 and 2004, respectively, with the final
refund payment of approximately $50 million received in 2006.
Page 2