Aetna 2006 Annual Report Download - page 18
Download and view the complete annual report
Please find page 18 of the 2006 Aetna annual report below. You can navigate through the pages in the report by either clicking on the pages listed below, or by using the keyword search tool below to find specific information within the annual report.-
 1
1 -
2
-
3
-
4
-
5
-
6
-
7
-
 8
8 -
 9
9 -
 10
10 -
 11
11 -
 12
12 -
 13
13 -
 14
14 -
 15
15 -
 16
16 -
 17
17 -
 18
18 -
 19
19 -
 20
20 -
 21
21 -
 22
22 -
 23
23 -
 24
24 -
 25
25 -
 26
26 -
 27
27 -
 28
28 -
29
-
30
-
31
-
32
-
33
-
34
-
35
-
36
-
37
-
38
-
39
-
40
-
41
-
42
-
43
-
44
-
45
-
46
-
47
-
48
-
49
-
50
-
51
-
52
-
53
-
54
-
55
-
56
-
57
-
58
-
59
-
60
-
61
-
62
-
63
-
64
-
65
-
66
-
67
-
68
-
69
-
70
-
71
-
72
-
73
-
74
-
75
-
76
-
77
-
78
-
79
-
80
-
81
-
82
-
83
-
84
-
85
-
86
-
87
-
88
-
89
-
90
-
91
-
92
-
93
-
94
-
95
-
96
-
97
-
98
-
99
-
100
-
101
-
102
 |
 |

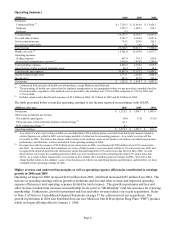
Equity securities reflect gross unrealized capital gains of $6 million (comprised principally of gross unrealized
capital gains) at December 31, 2006 compared with gross unrealized capital gains of $10 million at December 31,
2005.
If we believe a decline in the value of a particular investment is temporary, we record the decline as an unrealized
loss which is reflected in accumulated other comprehensive (loss) income (a component of shareholders’ equity). If
the decline is “other-than-temporary,” the carrying value of the investment is written down and a realized capital
loss is recorded in earnings consistent with the guidance of FAS No. 115, “Accounting for Certain Investments in
Debt and Equity Securities,” FASB Staff Position FAS 115-1 and FAS 124-1, “The Meaning of Other-Than-
Temporary Impairment and its Application to Certain Investments,” (“FSP 115-1”) and the Securities and Exchange
Commission’ s Staff Accounting Bulletin No. 59, “Accounting for Noncurrent Marketable & Equities Securities,”
(“SAB 59”). Evaluating declines in fair value below the carrying value for other-than-temporary impairments is
one of our critical accounting estimates. Refer to Critical Accounting Estimates – Other-Than-Temporary
Impairment of Investment Securities beginning on page 27 for additional information. At December 31, 2006 and
2005 the amount of gross unrealized losses and related fair value, of debt and equity securities were as follows:
(Millions) Fair Value Unrealized Losses Fair Value Unrealized Losses
Supporting discontinued and experience-rated products (1) 1,414.1$ 42.1$ 1,246.1$ 37.1$
Supporting remaining products (2) 5,053.0 96.5 4,718.0 92.5
Total 6,467.1$ 138.6$ 5,964.1$ 129.6$
2006 2005
(1) At December 31, 2006 and 2005, below investment grade and non-rated debt and equity securities in an unrealized loss position of
$1.0 million and $5.7 million, respectively, and related fair values of $36.8 million and $79.7 million, respectively, related to
securities supporting experience-rated and discontinued products.
(2) At December 31, 2006 and 2005, below investment grade and non-rated debt and equity securities in an unrealized loss position of
$4.6 million and $9.2 million, respectively, and related fair values of $159.8 million and $224.2 million, respectively, related to
securities supporting remaining products.
At December 31, 2006, the amount of unrealized losses and related fair value of debt and equity securities in an
unrealized loss position for greater than twelve months were $107 million and $3.4 billion, respectively, and such
amounts were $41 million and $1.3 billion, respectively, at December 31, 2005. Unrealized losses were generally
caused by current interest rates that are higher than the interest rates stated on our debt securities. We have the
ability and intent to hold these securities until their cost can be recovered. Therefore, at December 31, 2006 and
2005, no other-than-temporary impairments were deemed to have occurred. We had no material unrealized losses
on individual debt or equity securities at December 31, 2006 or 2005.
Net realized capital gains were $32 million ($24 million after tax) in 2006, $32 million ($21 million after tax) in
2005 and $71 million ($46 million after tax) in 2004. There were no significant investment write-downs from
other-than-temporary impairments in 2006, 2005 or 2004. We had no individually material losses on debt or equity
securities that impacted our results of operations in 2006, 2005, or 2004.
Mortgage Loans
Our mortgage loan investments supported the following types of products:
(Millions) 2006 2005
Supporting discontinued products 650.6$ 644.9$
Supporting experience-rated products 304.3 320.8
Supporting remaining products 633.3 581.8
Total mortgage loans 1,588.2$ 1,547.5$
The mortgage loan portfolio balance represented 9% of our total invested assets at both December 31, 2006 and
2005. There were no material problem, restructured or potential problem loans included in mortgage loans at
December 31, 2006 or 2005. There were no impairment reserves on mortgage loans at December 31, 2006 or 2005.
Refer to Notes 2 and 8 of Notes to Consolidated Financial Statements beginning on pages 48 and 60, respectively,
for additional information.
Page 16