eBay 2012 Annual Report Download - page 65
Download and view the complete annual report
Please find page 65 of the 2012 eBay annual report below. You can navigate through the pages in the report by either clicking on the pages listed below, or by using the keyword search tool below to find specific information within the annual report.-
 1
1 -
2
-
3
-
4
-
5
-
6
-
7
-
8
-
9
-
10
-
11
-
12
-
13
-
14
-
15
-
16
-
17
-
18
-
19
-
20
-
21
-
22
-
23
-
24
-
25
-
26
-
27
-
28
-
29
-
30
-
31
-
32
-
33
-
34
-
35
-
36
-
37
-
38
-
39
-
40
-
41
-
42
-
43
-
44
-
45
-
46
-
47
-
48
-
49
-
50
-
51
-
52
-
53
-
54
-
 55
55 -
 56
56 -
 57
57 -
 58
58 -
 59
59 -
 60
60 -
 61
61 -
 62
62 -
 63
63 -
 64
64 -
 65
65 -
 66
66 -
 67
67 -
 68
68 -
 69
69 -
 70
70 -
 71
71 -
 72
72 -
 73
73 -
 74
74 -
 75
75 -
76
-
77
-
78
-
79
-
80
-
81
-
82
-
83
-
84
-
85
-
86
-
87
-
88
-
89
-
90
-
91
-
92
-
93
-
94
-
95
-
96
-
97
-
98
-
99
-
100
-
101
-
102
-
103
-
104
-
105
-
106
-
107
-
108
-
109
-
110
-
111
-
112
-
113
-
114
-
115
-
116
-
117
-
118
-
119
-
120
-
121
-
122
-
123
-
124
-
125
-
126
-
127
-
128
-
129
-
130
-
131
-
132
-
133
-
134
-
135
-
136
-
137
-
138
-
139
-
140
-
141
-
142
-
143
-
144
-
145
-
146
-
147
-
148
-
149
-
150
-
151
-
152
-
153
-
154
-
155
-
156
-
157
-
158
-
159
-
160
-
161
-
162
 |
 |

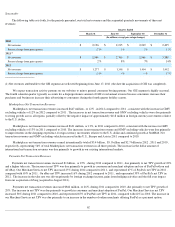
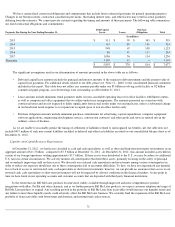
Seasonality
The following table sets forth, for the periods presented, our total net revenues and the sequential quarterly movements of these net
revenues:
We expect transaction activity patterns on our websites to mirror general consumer buying patterns. Our GSI segment is highly seasonal.
The fourth calendar quarter typically accounts for a disproportionate amount of GSI's total annual revenue because consumers increase their
purchases and businesses increase their advertising to consumers during the fourth quarter holiday season.
Marketplaces Net Transaction Revenues
Marketplaces net transaction revenues increased $647 million , or 12% , in 2012 compared to 2011 , consistent with the increase in GMV
excluding vehicles of 12% in 2012 compared to 2011
. The increases in net transaction revenue and GMV excluding vehicles were due primarily
to strong growth across all regions, partially offset by the negative impact of approximately $118 million in foreign currency movements relative
to the U.S. dollar.
Marketplaces net transaction revenues increased $631 million, or 13%, in 2011 compared to 2010, consistent with the increase in GMV
excluding vehicles of 13% in 2011 compared to 2010. The increases in net transaction revenue and GMV excluding vehicles were due primarily
to improvements in the shopping experience, foreign currency movements relative to the U.S. dollar and continued growth at StubHub. Net
transaction revenues and GMV excluding vehicles increased in the U.S., Europe and Asia in 2011 compared to 2010.
Marketplaces net transaction revenues earned internationally totaled $3.4 billion , $3.1 billion and $2.7 billion in 2012 , 2011 and 2010 ,
respectively, representing 56% of total Marketplaces net transaction revenues in all three periods. The increase in the dollar amount of
international net transaction revenues was due primarily to growth in our existing international markets.
Payments Net Transaction Revenues
Payments net transaction revenues increased $1 billion , or 25% , during 2012 compared to 2011 , due primarily to net TPV growth of
22%
and a higher take rate. The increase in net TPV was due primarily to growth in consumer and merchant adoption and use of PayPal both on and
off eBay. Our Merchant Services net TPV increased 25% during 2012 compared to 2011 , and represented 67% of PayPal's net TPV in 2012 ,
compared with 65% in 2011 . On eBay net TPV increased 16% during 2012 compared to 2011 , and represented 33% of PayPal's net TPV in
2012 . The increase in the take rate was driven primarily by foreign exchange income, gains from hedging activities and the full year impact
from our acquisition of Zong (acquired in August 2011).
Payments net transaction revenues increased $862 million, or 26%, during 2011 compared to 2010, due primarily to net TPV growth of
29%. The increase in net TPV was due primarily to growth in consumer and merchant adoption of PayPal. Our Merchant Services net TPV
increased 36% during 2011 compared to 2010, and represented 65% of PayPal's net TPV in 2011, compared with 62% in 2010. The increase in
our Merchant Services net TPV was due primarily to an increase in the number of online merchants offering PayPal as a payment option.
62
Quarter Ended
March 31
June 30
September 30
December 31
(In millions, except percentage changes)
2010
Net revenues
$
2,196
$
2,215
$
2,249
$
2,495
Percent change from prior quarter
(7
)%
1
%
2
%
11
%
2011
(1)
Net revenues
$
2,546
$
2,760
$
2,966
$
3,380
Percent change from prior quarter
2
%
8
%
7
%
14
%
2012
Net revenues
$
3,277
$
3,398
$
3,404
$
3,992
Percent change from prior quarter
(3
)%
4
%
—
%
17
%
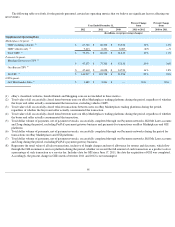
(1)
Net revenues attributable to the GSI segment are reflected beginning from June 17, 2011 (the date the acquisition of GSI was completed).