eBay 2012 Annual Report Download - page 105
Download and view the complete annual report
Please find page 105 of the 2012 eBay annual report below. You can navigate through the pages in the report by either clicking on the pages listed below, or by using the keyword search tool below to find specific information within the annual report.-
 1
1 -
2
-
3
-
4
-
5
-
6
-
7
-
8
-
9
-
10
-
11
-
12
-
13
-
14
-
15
-
16
-
17
-
18
-
19
-
20
-
21
-
22
-
23
-
24
-
25
-
26
-
27
-
28
-
29
-
30
-
31
-
32
-
33
-
34
-
35
-
36
-
37
-
38
-
39
-
40
-
41
-
42
-
43
-
44
-
45
-
46
-
47
-
48
-
49
-
50
-
51
-
52
-
53
-
54
-
55
-
56
-
57
-
58
-
59
-
60
-
61
-
62
-
63
-
64
-
65
-
66
-
67
-
68
-
69
-
70
-
71
-
72
-
73
-
74
-
75
-
76
-
77
-
78
-
79
-
80
-
81
-
82
-
83
-
84
-
85
-
86
-
87
-
88
-
89
-
90
-
91
-
92
-
93
-
94
-
 95
95 -
 96
96 -
 97
97 -
 98
98 -
 99
99 -
 100
100 -
 101
101 -
 102
102 -
 103
103 -
 104
104 -
 105
105 -
 106
106 -
 107
107 -
 108
108 -
 109
109 -
 110
110 -
 111
111 -
 112
112 -
 113
113 -
 114
114 -
 115
115 -
116
-
117
-
118
-
119
-
120
-
121
-
122
-
123
-
124
-
125
-
126
-
127
-
128
-
129
-
130
-
131
-
132
-
133
-
134
-
135
-
136
-
137
-
138
-
139
-
140
-
141
-
142
-
143
-
144
-
145
-
146
-
147
-
148
-
149
-
150
-
151
-
152
-
153
-
154
-
155
-
156
-
157
-
158
-
159
-
160
-
161
-
162
 |
 |

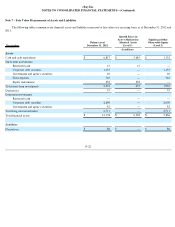
eBay Inc.
NOTES TO CONSOLIDATED FINANCIAL STATEMENTS—(Continued)
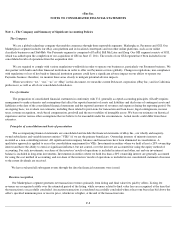
We also economically hedge our exposure to foreign currency denominated monetary assets and liabilities with foreign currency contracts.
The gains and losses on the foreign exchange contracts economically offset transaction gains and losses on certain foreign currency denominated
monetary assets and liabilities recognized in earnings. Accordingly, these outstanding non-designated derivatives are recognized on the balance
sheet at fair value and changes in fair value from these contracts are recorded in interest and other, net in the consolidated statement of income.
Our derivatives program is not designed or operated for trading or speculative purposes.
Our derivative instruments expose us to credit risk to the extent that our counterparties may be unable to meet the terms of the agreements.
We seek to mitigate this risk by limiting our counterparties to major financial institutions and by spreading the risk across several major financial
institutions. In addition, the potential risk of loss with any one counterparty resulting from this type of credit risk is monitored on an ongoing
basis. See “Note 8 - Derivative Instruments” for additional information related to our derivative instruments.
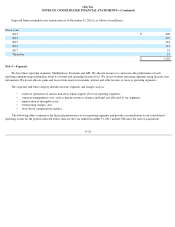
Concentration of credit risk
Our cash, cash equivalents, accounts receivable, loans and interest receivable, funds receivable and customer accounts are potentially
subject to concentration of credit risk. Cash, cash equivalents and customer accounts are placed with financial institutions that management
believes are of high credit quality. In addition, funds receivable are generated with financial institutions or credit card companies that
management believes are of high credit quality. Our accounts receivable are derived from revenue earned from customers located in the U.S. and
internationally. Our loans and interest receivable are derived from consumer financing activities for customers located in the U.S. As of
December 31, 2012 and 2011 , no customer accounted for more than 10% of net accounts receivable or net loans receivable. During the years
ended December 31, 2012, 2011 and 2010 , no customer accounted for more than 10% of net revenues.
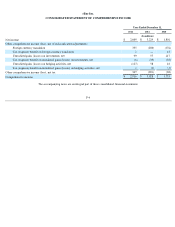
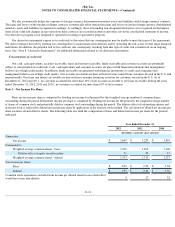
Note 2 – Net Income Per Share
Basic net income per share is computed by dividing net income for the period by the weighted average number of common shares
outstanding during the period. Diluted net income per share is computed by dividing net income for the period by the weighted average number
of shares of common stock and potentially dilutive common stock outstanding during the period. The dilutive effect of outstanding options and
restricted stock is reflected in diluted net income per share by application of the treasury stock method. The calculation of diluted net income per
share excludes all anti-dilutive shares. The following table sets forth the computation of basic and diluted net income per share for the periods
indicated:
F-13
Year Ended December 31,
2012
2011
2010
(In millions, except per share amounts)
Numerator:
Net income
$
2,609
$
3,229
$
1,801
Denominator:
Weighted average common shares - basic
1,292
1,293
1,306
Dilutive effect of equity incentive plans
21
20
21
Weighted average common shares - diluted
1,313
1,313
1,327
Net income per share:
Basic
$
2.02
$
2.50
$
1.38
Diluted
$
1.99
$
2.46
$
1.36
Common stock equivalents excluded from income per diluted share because their effect
would have been anti-dilutive
4
17
32