eBay 2009 Annual Report Download - page 90
Download and view the complete annual report
Please find page 90 of the 2009 eBay annual report below. You can navigate through the pages in the report by either clicking on the pages listed below, or by using the keyword search tool below to find specific information within the annual report.-
 1
1 -
2
-
3
-
4
-
5
-
6
-
7
-
8
-
9
-
10
-
11
-
12
-
13
-
14
-
15
-
16
-
17
-
18
-
19
-
20
-
21
-
22
-
23
-
24
-
25
-
26
-
27
-
28
-
29
-
30
-
31
-
32
-
33
-
34
-
35
-
36
-
37
-
38
-
39
-
40
-
41
-
42
-
43
-
44
-
45
-
46
-
47
-
48
-
49
-
50
-
51
-
52
-
53
-
54
-
55
-
56
-
57
-
58
-
59
-
60
-
61
-
62
-
63
-
64
-
65
-
66
-
67
-
68
-
69
-
70
-
71
-
72
-
73
-
74
-
75
-
76
-
77
-
78
-
79
-
 80
80 -
 81
81 -
 82
82 -
 83
83 -
 84
84 -
 85
85 -
 86
86 -
 87
87 -
 88
88 -
 89
89 -
 90
90 -
 91
91 -
 92
92 -
 93
93 -
 94
94 -
 95
95 -
 96
96 -
 97
97 -
 98
98 -
 99
99 -
 100
100 -
101
-
102
-
103
-
104
-
105
-
106
-
107
-
108
-
109
-
110
-
111
-
112
-
113
-
114
-
115
-
116
-
117
-
118
-
119
-
120
-
121
-
122
-
123
-
124
-
125
-
126
-
127
-
128
-
129
-
130
-
131
-
132
-
133
-
134
-
135
-
136
-
137
-
138
-
139
-
140
 |
 |

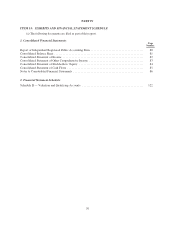
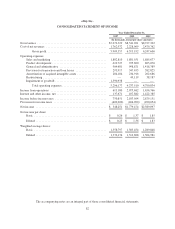
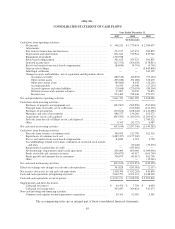
eBay Inc.
CONSOLIDATED STATEMENT OF INCOME
Year Ended December 31,
2007 2008 2009
(In thousands, except per share amounts)
Net revenues ............................................... $7,672,329 $8,541,261 $8,727,362
Cost of net revenues ......................................... 1,762,972 2,228,069 2,479,762
Gross profit ........................................ 5,909,357 6,313,192 6,247,600
Operating expenses:
Sales and marketing ..................................... 1,882,810 1,881,551 1,885,677
Product development ..................................... 619,727 725,600 803,070
General and administrative ................................ 904,681 998,871 1,418,389
Provision for transaction and loan losses ..................... 293,917 347,453 382,825
Amortization of acquired intangible assets .................... 204,104 234,916 262,686
Restructuring ........................................... — 49,119 38,187
Impairment of goodwill ................................... 1,390,938 — —
Total operating expenses .............................. 5,296,177 4,237,510 4,790,834
Income from operations ...................................... 613,180 2,075,682 1,456,766
Interest and other income, net .................................. 137,671 107,882 1,422,385
Income before income taxes ................................... 750,851 2,183,564 2,879,151
Provision for income taxes .................................... (402,600) (404,090) (490,054)
Net income ................................................ $ 348,251 $1,779,474 $2,389,097
Net income per share:
Basic ................................................. $ 0.26 $ 1.37 $ 1.85
Diluted ................................................ $ 0.25 $ 1.36 $ 1.83
Weighted average shares:
Basic ................................................. 1,358,797 1,303,454 1,289,848
Diluted ................................................ 1,376,174 1,312,608 1,304,981
The accompanying notes are an integral part of these consolidated financial statements.
82