eBay 2009 Annual Report Download - page 66
Download and view the complete annual report
Please find page 66 of the 2009 eBay annual report below. You can navigate through the pages in the report by either clicking on the pages listed below, or by using the keyword search tool below to find specific information within the annual report.-
 1
1 -
2
-
3
-
4
-
5
-
6
-
7
-
8
-
9
-
10
-
11
-
12
-
13
-
14
-
15
-
16
-
17
-
18
-
19
-
20
-
21
-
22
-
23
-
24
-
25
-
26
-
27
-
28
-
29
-
30
-
31
-
32
-
33
-
34
-
35
-
36
-
37
-
38
-
39
-
40
-
41
-
42
-
43
-
44
-
45
-
46
-
47
-
48
-
49
-
50
-
51
-
52
-
53
-
54
-
55
-
 56
56 -
 57
57 -
 58
58 -
 59
59 -
 60
60 -
 61
61 -
 62
62 -
 63
63 -
 64
64 -
 65
65 -
 66
66 -
 67
67 -
 68
68 -
 69
69 -
 70
70 -
 71
71 -
 72
72 -
 73
73 -
 74
74 -
 75
75 -
 76
76 -
77
-
78
-
79
-
80
-
81
-
82
-
83
-
84
-
85
-
86
-
87
-
88
-
89
-
90
-
91
-
92
-
93
-
94
-
95
-
96
-
97
-
98
-
99
-
100
-
101
-
102
-
103
-
104
-
105
-
106
-
107
-
108
-
109
-
110
-
111
-
112
-
113
-
114
-
115
-
116
-
117
-
118
-
119
-
120
-
121
-
122
-
123
-
124
-
125
-
126
-
127
-
128
-
129
-
130
-
131
-
132
-
133
-
134
-
135
-
136
-
137
-
138
-
139
-
140
 |
 |

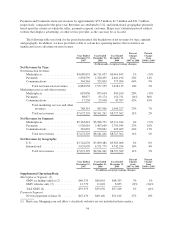
operations costs as a result of our increased focus on customer care initiatives and the expansion of our site
operations. Marketplaces cost of net revenues increased as a percentage of Marketplaces net revenues during
2008 due primarily to the impact of seller discounts and buyer loyalty programs (which are recorded as a
reduction in revenue) and the growth of lower margin Marketplaces businesses.
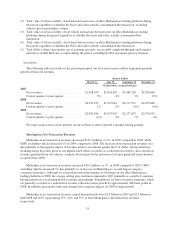
Payments
Payments cost of net revenues increased $183.9 million, or 18%, in 2009 compared to 2008. The increase in
cost of net revenues was primarily due to the inclusion of costs attributable to Bill Me Later (acquired November
2008) as well as the impact from our growth in net TPV. Cost of net revenues as a percentage of Payments net
revenues increased during 2009 compared to 2008 due primarily to the impact of lower take rates and increased
investment in our site operations, partially offset by a more favorable geographic and payment processor mix.
Payments cost of net revenues increased $269.9 million, or 35%, in 2008 compared to 2007. The increase in
cost of net revenues was primarily due to a $158.8 million, or 29%, increase in payment processing. The increase
in payment processing costs was driven primarily by an increase in net TPV driven by growth in our Merchant
Services business and the increase in PayPal’s penetration of eBay Marketplaces GMV. Aggregate customer
support and site operations costs increased $95.8 million in 2008 compared to 2007 due primarily to the
development and expansion of our customer support and site operations due to growth in transaction volume.
Payments cost of net revenues as a percentage of Payments net revenues during 2008 increased due primarily to
growth in our Merchant Services net TPV and the inclusion of Bill Me Later (acquired November 2008).
Communications
Communications cost of net revenues increased $6.7 million, or 2%, in 2009 compared to 2008. The
increase in cost of net revenues was due to an increase in SkypeOut minutes. Cost of net revenues decreased as a
percentage of Communications net revenues due primarily to higher volume and changes in product mix.
Communications cost of net revenues increased $59.5 million, or 26%, in 2008 compared to 2007. The
increase in cost of net revenues was due to an increase in SkypeOut minutes. Cost of net revenues decreased as a
percentage of Communications net revenues due primarily to higher volume and changes in product mix.
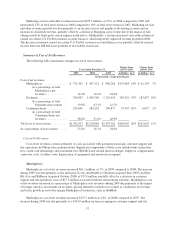
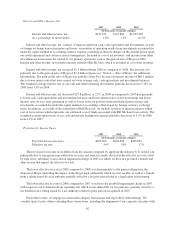
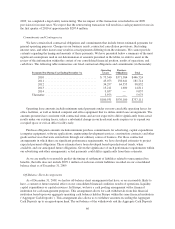
Summary of Operating Expenses, Non-Operating Items and Provision for Income Taxes
The following table summarizes changes in operating expenses, non-operating items and provision for
income taxes:
Year Ended December 31,
Change from
2007 to 2008
Change from
2008 to 2009
2007 2008 2009 in Dollars in % in Dollars in %
(In thousands, except percentage changes)
Sales and marketing .......... $1,882,810 $1,881,551 $1,885,677 $ (1,259) (0)%$ 4,126 0%
Product development ......... 619,727 725,600 803,070 105,873 17% 77,470 11%
General and administrative ..... 904,681 998,871 1,418,389 94,190 10% 419,518 42%
Provision for transaction and
loan losses ................ 293,917 347,453 382,825 53,536 18% 35,372 10%
Amortization of acquired
intangible assets ........... 204,104 234,916 262,686 30,812 15% 27,770 12%
Restructuring ................ — 49,119 38,187 49,119 100% (10,932) (22)%
Impairment of goodwill ....... 1,390,938 — — (1,390,938) (100)% — N/A
Interest and other income, net . . . 137,671 107,882 1,422,385 (29,789) (22)% 1,314,503 1218%
Provision for income taxes ..... 402,600 404,090 490,054 1,490 0% 85,964 21%
58