eBay 2006 Annual Report Download - page 57
Download and view the complete annual report
Please find page 57 of the 2006 eBay annual report below. You can navigate through the pages in the report by either clicking on the pages listed below, or by using the keyword search tool below to find specific information within the annual report.-
 1
1 -
2
-
3
-
4
-
5
-
6
-
7
-
8
-
9
-
10
-
11
-
12
-
13
-
14
-
15
-
16
-
17
-
18
-
19
-
20
-
21
-
22
-
23
-
24
-
25
-
26
-
27
-
28
-
29
-
30
-
31
-
32
-
33
-
34
-
35
-
36
-
37
-
38
-
39
-
40
-
41
-
42
-
43
-
44
-
45
-
46
-
 47
47 -
 48
48 -
 49
49 -
 50
50 -
 51
51 -
 52
52 -
 53
53 -
 54
54 -
 55
55 -
 56
56 -
 57
57 -
 58
58 -
 59
59 -
 60
60 -
 61
61 -
 62
62 -
 63
63 -
 64
64 -
 65
65 -
 66
66 -
 67
67 -
68
-
69
-
70
-
71
-
72
-
73
-
74
-
75
-
76
-
77
-
78
-
79
-
80
-
81
-
82
-
83
-
84
-
85
-
86
-
87
-
88
-
89
-
90
-
91
-
92
-
93
-
94
-
95
-
96
-
97
-
98
-
99
-
100
-
101
-
102
-
103
-
104
-
105
-
106
-
107
-
108
-
109
-
110
-
111
-
112
-
113
-
114
 |
 |

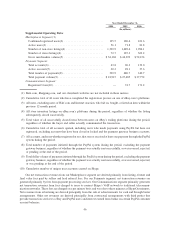
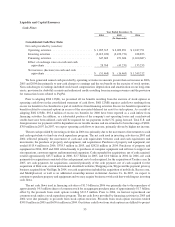
due to our stock repurchase activity in 2006. The weighted-average interest rate of our portfolio increased to 3.8% in
2006 from 2.9% in 2005.
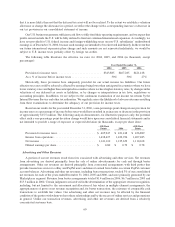
Our interest and other income, net increased in total and remained consistent as a percentage of net revenues
during 2005 as compared to the prior year, primarily as a result of increased interest income due to increased cash,
cash equivalents and investments balances and higher interest rates. The weighted-average interest rate of our
portfolio increased to 2.9% in 2005 from 1.7% in 2004.
We expect that interest and other income, net, will decline slightly during 2007 compared to 2006, as a result of
lower cash balances due to our stock repurchase program. Our expectation for interest and other income, net, for
2007 excludes the potential effects from any future acquisitions we may make.
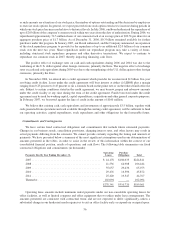
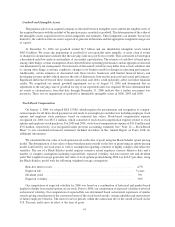
Interest Expense
2004 2005 2006
(In thousands, except percentages)
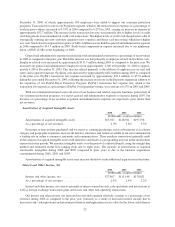
Interest expense ...................................... $8,879 $3,478 $5,916
As a percentage of net revenues .......................... 0.3% 0.1% 0.1%
Interest expense consists of interest charges on tax contingencies, legal accruals, capital leases and our
consolidated lease arrangement related to our San Jose headquarters office facilities. In 2007, interest expense may
be impacted by our decision to utilize our line of credit. See additional discussion of our line of credit in “Note 8 —
Commitments and Contingencies” to our consolidated financial statements included elsewhere in this Annual
Report on Form 10-K.
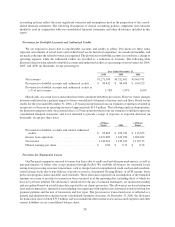
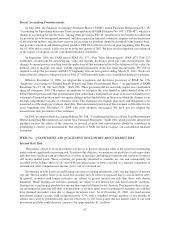
Provision for Income Taxes
2004 2005 2006
(In thousands, except percentages)
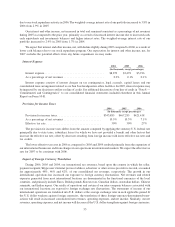
Provision for income taxes ............................ $343,885 $467,285 $421,418
As a percentage of net revenues ........................ 10.5% 10.3% 7.1%
Effective tax rate ................................... 30% 30% 27%
The provision for income taxes differs from the amount computed by applying the statutory U.S. federal rate
principally due to state taxes, subsidiary losses for which we have not provided a benefit and other factors that
increase the effective tax rate, offset by decreases resulting from foreign income with lower effective tax rates and
tax credits.
The lower effective tax rates in 2006 as compared to 2005 and 2004 resulted primarily from the expansion of
our international businesses and from changes in our operations in international markets. We expect the effective tax
rate for 2007 to be consistent with 2006.
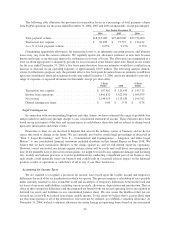
Impact of Foreign Currency Translation
During 2006, 2005 and 2004, our international net revenues, based upon the country in which the seller,
payment recipient, Skype user’s Internet protocol address, advertiser or other service provider is located, accounted
for approximately 48%, 46% and 42%, of our consolidated net revenues, respectively. The growth in our
international operations has increased our exposure to foreign currency fluctuations. Net revenues and related
expenses generated from most international locations are denominated in the functional currencies of the local
countries, and primarily include Euros, British pounds, Korean won, Canadian dollars, Australian dollars, Chinese
renminbi, and Indian rupees. Our results of operations and certain of our inter-company balances associated with
our international locations are exposed to foreign exchange rate fluctuations. The statements of income of our
international operations are translated into U.S. dollars at the average exchange rates in each applicable period. If
the U.S. dollar weakens against foreign currencies, the translation of these foreign-currency-denominated trans-
actions will result in increased consolidated net revenues, operating expenses, and net income. Similarly, our net
revenues, operating expenses, and net income will decrease if the U.S. dollar strengthens against foreign currencies.
53