eBay 2006 Annual Report Download - page 53
Download and view the complete annual report
Please find page 53 of the 2006 eBay annual report below. You can navigate through the pages in the report by either clicking on the pages listed below, or by using the keyword search tool below to find specific information within the annual report.-
 1
1 -
2
-
3
-
4
-
5
-
6
-
7
-
8
-
9
-
10
-
11
-
12
-
13
-
14
-
15
-
16
-
17
-
18
-
19
-
20
-
21
-
22
-
23
-
24
-
25
-
26
-
27
-
28
-
29
-
30
-
31
-
32
-
33
-
34
-
35
-
36
-
37
-
38
-
39
-
40
-
41
-
42
-
 43
43 -
 44
44 -
 45
45 -
 46
46 -
 47
47 -
 48
48 -
 49
49 -
 50
50 -
 51
51 -
 52
52 -
 53
53 -
 54
54 -
 55
55 -
 56
56 -
 57
57 -
 58
58 -
 59
59 -
 60
60 -
 61
61 -
 62
62 -
 63
63 -
64
-
65
-
66
-
67
-
68
-
69
-
70
-
71
-
72
-
73
-
74
-
75
-
76
-
77
-
78
-
79
-
80
-
81
-
82
-
83
-
84
-
85
-
86
-
87
-
88
-
89
-
90
-
91
-
92
-
93
-
94
-
95
-
96
-
97
-
98
-
99
-
100
-
101
-
102
-
103
-
104
-
105
-
106
-
107
-
108
-
109
-
110
-
111
-
112
-
113
-
114
 |
 |

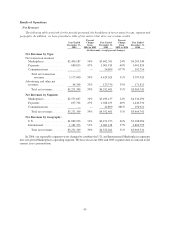
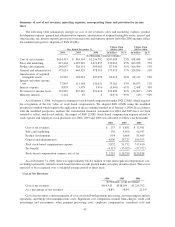
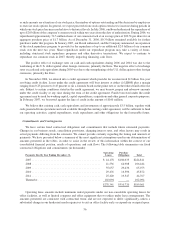
Summary of cost of net revenues, operating expenses, non-operating items and provision for income
taxes
The following table summarizes changes in cost of net revenues, sales and marketing expense, product
development expense, general and administrative expense, amortization of acquired intangible assets, interest and
other income, net, interest expense, provision for income taxes and minority interest (note that 2006 amounts reflect
the modified prospective adoption of FAS 123(R)):
2004 2005 2006 In dollars In % In dollars In %
Year Ended December 31,
Change from
2004 to 2005
Change from
2005 to 2006
(In thousands, except percentages)
Cost of net revenues ....... $614,415 $ 818,104 $1,256,792 $203,689 33% 438,688 54%
Sales and marketing ....... 815,464 1,185,929 1,619,857 370,465 45% 433,928 37%
Product development ...... 240,647 328,191 494,695 87,544 36% 166,504 51%
General and administrative . . 475,614 649,529 978,363 173,915 37% 328,834 51%
Amortization of acquired
intangible assets ........ 65,927 128,941 197,078 63,014 96% 68,137 53%
Interest and other income,
net.................. 77,867 111,148 130,021 33,281 43% 18,873 17%
Interest expense . ......... 8,879 3,478 5,916 (5,401) ⫺61% 2,438 70%
Provision for income taxes . . 343,885 467,285 421,418 123,400 36% (45,867) ⫺10%
Minority interests ......... 6,122 49 4 (6,073) ⫺99% (45) ⫺92%
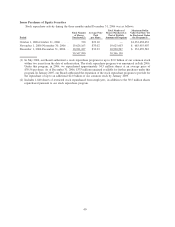
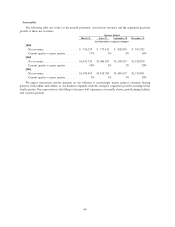
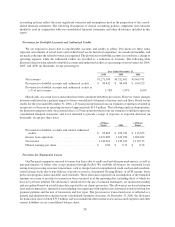
As of January 1, 2006, we began accounting for stock-based compensation under FAS 123(R), which requires
the recognition of the fair value of stock-based compensation. We adopted FAS 123(R) using the modified
prospective method which requires the application of the accounting standard as of January 1, 2006. In accordance
with the modified prospective method, the consolidated financial statements for 2004 and 2005 have not been
restated to reflect, and do not include, the impact of FAS 123(R). Stock-based compensation expense related to
stock options and employee stock purchases for 2004, 2005 and 2006 was allocated as follows (in thousands):
2004 2005 2006
Cost of net revenues .................................. $ 233 $ 1,881 $ 32,981
Sales and marketing .................................. 136 8,696 96,547
Product development .................................. 654 6,468 81,489
General and administrative ............................. 4,809 14,727 106,393
Total stock-based compensation expense ................... 5,832 31,772 317,410
Tax benefit ......................................... (4,117) (13,023) (97,572)
Stock-based compensation expense, net of tax ............... $1,715 $ 18,749 $219,838
As of December 31, 2006, there was approximately $418.4 million of total unrecognized compensation cost,
excluding tax benefits, related to stock-based incentive awards granted under our equity incentive plans. That cost is
expected to be recognized over a weighted-average period of three years.
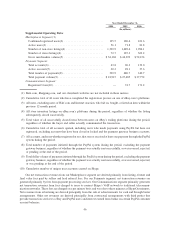
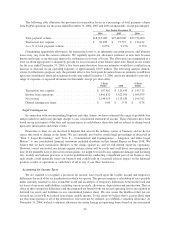
Cost of Net Revenues
2004 2005 2006
(In thousands, except percentages)
Cost of net revenues ............................... $614,415 $818,104 $1,256,792
As a percentage of net revenues ....................... 18.8% 18.0% 21.1%
Cost of net revenues consists primarily of costs associated with payment processing, customer support and site
operations, and Skype telecommunications costs. Significant cost components include bank charges, credit card
interchange and assessments, other payment processing costs, employee compensation, consultant costs and
49