XM Radio 2011 Annual Report Download - page 70
Download and view the complete annual report
Please find page 70 of the 2011 XM Radio annual report below. You can navigate through the pages in the report by either clicking on the pages listed below, or by using the keyword search tool below to find specific information within the annual report.-
 1
1 -
2
-
3
-
4
-
5
-
6
-
7
-
8
-
9
-
10
-
11
-
12
-
13
-
14
-
15
-
16
-
17
-
18
-
19
-
20
-
21
-
22
-
23
-
24
-
25
-
26
-
27
-
28
-
29
-
30
-
31
-
32
-
33
-
34
-
35
-
36
-
37
-
38
-
39
-
40
-
41
-
42
-
43
-
44
-
45
-
46
-
47
-
48
-
49
-
50
-
51
-
52
-
53
-
54
-
55
-
56
-
57
-
58
-
59
-
 60
60 -
 61
61 -
 62
62 -
 63
63 -
 64
64 -
 65
65 -
 66
66 -
 67
67 -
 68
68 -
 69
69 -
 70
70 -
 71
71 -
 72
72 -
 73
73 -
 74
74 -
 75
75 -
 76
76 -
 77
77 -
 78
78 -
 79
79 -
 80
80 -
81
-
82
-
83
-
84
-
85
-
86
-
87
-
88
-
89
-
90
-
91
-
92
-
93
-
94
-
95
-
96
-
97
-
98
-
99
-
100
-
101
-
102
-
103
-
104
-
105
-
106
-
107
-
108
-
109
-
110
-
111
-
112
-
113
-
114
-
115
-
116
-
117
-
118
-
119
-
120
-
121
-
122
-
123
-
124
-
125
-
126
-
127
-
128
-
129
-
130
-
131
-
132
 |
 |

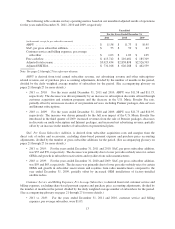
•2010 vs. 2009: For the years ended December 31, 2010 and 2009, customer service and billing
expenses, per average subscriber, were $1.03 and $1.05, respectively. The decrease was primarily due to
lower call center expenses as a result of moving calls to lower cost locations, partially offset by higher
call volume.
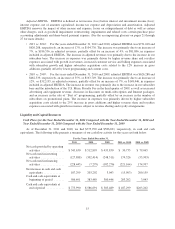
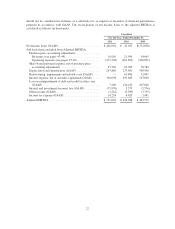
Free Cash Flow includes the net cash provided by operations, additions to property and equipment, and
restricted and other investment activity. (See accompanying glossary on pages 21 through 27 for more details.)
•2011 vs. 2010: For the years ended December 31, 2011 and 2010, free cash flow was $415,742 and
$210,481, respectively, an increase of $205,261. Net cash provided by operating activities increased
$30,735 to $543,630 for the year ended December 31, 2011 compared to the $512,895 provided by
operations for the year ended December 31, 2010. Capital expenditures for property and equipment for
the year ended December 31, 2011 decreased $174,439 to $137,429 compared to $311,868 for the year
ended December 31, 2010. The increase in net cash provided by operating activities was primarily the
result of improved operating performance driving higher adjusted EBITDA, cash received from the
Canada Merger, higher collections from subscribers and distributors, and the repayment in the first
quarter of 2010 of liabilities deferred in 2009. The decrease in capital expenditures for the year ended
December 31, 2011 was primarily the result of decreased satellite construction and launch expenditures
due to the launch in 2010 of our XM-5 satellite. The increase in restricted and other investment activities
was driven by the return of capital resulting from the Canada Merger, partially offset by proceeds from
the sale of investment securities in the year ended December 31, 2010.
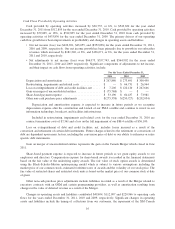
•2010 vs. 2009: For the years ended December 31, 2010 and 2009, free cash flow was $210,481 and
$185,319, respectively, an increase of $25,162. Net cash provided by operating activities increased
$79,065 to $512,895 for the year ended December 31, 2010 compared to the $433,830 provided by
operations for the year ended December 31, 2009. Capital expenditures for property and equipment for
the year ended December 31, 2010 increased $63,357 to $311,868 compared to $248,511 for the year
ended December 31, 2009. The increase in net cash provided by operating activities was primarily the
result of growth in deferred revenue and changes in net assets. The increase in capital expenditures for the
year ended December 31, 2010 was primarily the result of satellite construction and launch expenditures
for our XM-5 and FM-6 satellites.
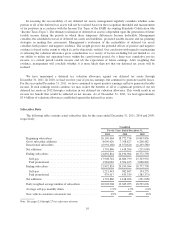
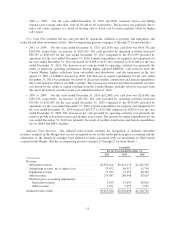
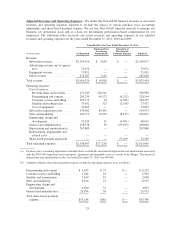
Adjusted Total Revenue. Our adjusted total revenue includes the recognition of deferred subscriber
revenues acquired in the Merger that are not recognized in our results under purchase price accounting and the
elimination of the benefit in earnings from deferred revenue associated with our investment in XM Canada
acquired in the Merger. (See the accompanying glossary on pages 21 through 27 for more details.)
Unaudited
For the Years Ended December 31,
2011 2010 2009
(in thousands)
Revenue:
Subscriber revenue ............................. $2,595,414 $2,414,174 $2,287,503
Advertising revenue, net of agency fees ............. 73,672 64,517 51,754
Equipment revenue ............................. 71,051 71,355 50,352
Other revenue ................................. 274,387 266,946 83,029
Purchase price accounting adjustments: .............
Subscriber revenue ........................... 3,659 14,655 46,814
Other revenue ............................... 7,251 7,251 7,251
Adjusted total revenue ............................. $3,025,434 $2,838,898 $2,526,703
14