XM Radio 2011 Annual Report Download - page 58
Download and view the complete annual report
Please find page 58 of the 2011 XM Radio annual report below. You can navigate through the pages in the report by either clicking on the pages listed below, or by using the keyword search tool below to find specific information within the annual report.-
 1
1 -
2
-
3
-
4
-
5
-
6
-
7
-
8
-
9
-
10
-
11
-
12
-
13
-
14
-
15
-
16
-
17
-
18
-
19
-
20
-
21
-
22
-
23
-
24
-
25
-
26
-
27
-
28
-
29
-
30
-
31
-
32
-
33
-
34
-
35
-
36
-
37
-
38
-
39
-
40
-
41
-
42
-
43
-
44
-
45
-
46
-
47
-
 48
48 -
 49
49 -
 50
50 -
 51
51 -
 52
52 -
 53
53 -
 54
54 -
 55
55 -
 56
56 -
 57
57 -
 58
58 -
 59
59 -
 60
60 -
 61
61 -
 62
62 -
 63
63 -
 64
64 -
 65
65 -
 66
66 -
 67
67 -
 68
68 -
69
-
70
-
71
-
72
-
73
-
74
-
75
-
76
-
77
-
78
-
79
-
80
-
81
-
82
-
83
-
84
-
85
-
86
-
87
-
88
-
89
-
90
-
91
-
92
-
93
-
94
-
95
-
96
-
97
-
98
-
99
-
100
-
101
-
102
-
103
-
104
-
105
-
106
-
107
-
108
-
109
-
110
-
111
-
112
-
113
-
114
-
115
-
116
-
117
-
118
-
119
-
120
-
121
-
122
-
123
-
124
-
125
-
126
-
127
-
128
-
129
-
130
-
131
-
132
 |
 |

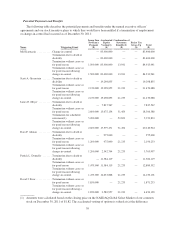
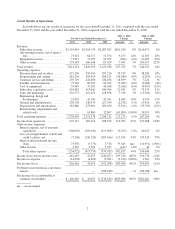
Actual Results of Operations
Set forth below are our results of operations for the year ended December 31, 2011 compared with the year ended
December 31, 2010 and the year ended December 31, 2010 compared with the year ended December 31, 2009.
For the Years Ended December 31,
2011 vs 2010
Change
2010 vs 2009
Change
2011 2010 2009 Amount % Amount %
Revenue:
Subscriber revenue .............. $2,595,414 $2,414,174 $2,287,503 $181,240 8% $126,671 6%
Advertising revenue, net of agency
fees ........................ 73,672 64,517 51,754 9,155 14% 12,763 25%
Equipment revenue .............. 71,051 71,355 50,352 (304) (0%) 21,003 42%
Other revenue .................. 274,387 266,946 83,029 7,441 3% 183,917 222%
Total revenue .................... 3,014,524 2,816,992 2,472,638 197,532 7% 344,354 14%
Operating expenses:
Revenue share and royalties ....... 471,149 435,410 397,210 35,739 8% 38,200 10%
Programming and content ........ 281,234 305,914 308,121 (24,680) (8%) (2,207) (1%)
Customer service and billing ...... 259,719 241,680 234,456 18,039 7% 7,224 3%
Satellite and transmission ......... 75,902 80,947 84,033 (5,045) (6%) (3,086) (4%)
Cost of equipment .............. 33,095 35,281 40,188 (2,186) (6%) (4,907) (12%)
Subscriber acquisition costs ....... 434,482 413,041 340,506 21,441 5% 72,535 21%
Sales and marketing ............. 222,773 215,454 228,956 7,319 3% (13,502) (6%)
Engineering, design and
development ................. 53,435 45,390 41,031 8,045 18% 4,359 11%
General and administrative ....... 238,738 240,970 227,554 (2,232) (1%) 13,416 6%
Depreciation and amortization ..... 267,880 273,691 309,450 (5,811) (2%) (35,759) (12%)
Restructuring, impairments and
related costs ................. — 63,800 32,807 (63,800) (100%) 30,993 94%
Total operating expenses ........... 2,338,407 2,351,578 2,244,312 (13,171) (1%) 107,266 5%
Income from operations ............ 676,117 465,414 228,326 210,703 45% 237,088 104%
Other income (expense):
Interest expense, net of amounts
capitalized .................. (304,938) (295,643) (315,668) (9,295) (3%) 20,025 6%
Loss on extinguishment of debt and
credit facilities, net ............ (7,206) (120,120) (267,646) 112,914 94% 147,526 55%
Interest and investment income
(loss) ....................... 73,970 (5,375) 5,576 79,345 nm (10,951) (196%)
Other income .................. 3,252 3,399 3,355 (147) (4%) 44 1%
Total other expense ........... (234,922) (417,739) (574,383) 182,817 44% 156,644 27%
Income (loss) before income taxes .... 441,195 47,675 (346,057) 393,520 825% 393,732 114%
Income tax expense ............... (14,234) (4,620) (5,981) (9,614) (208%) 1,361 23%
Net income (loss) ................. 426,961 43,055 (352,038) 383,906 892% 395,093 112%
Preferred stock beneficial conversion
feature ........................ — — (186,188) — —% 186,188 nm
Net income (loss) attributable to
common stockholders ............ $ 426,961 $ 43,055 $ (538,226) $383,906 892% $581,281 108%
nm — not meaningful
2