Westjet 2005 Annual Report Download - page 5
Download and view the complete annual report
Please find page 5 of the 2005 Westjet annual report below. You can navigate through the pages in the report by either clicking on the pages listed below, or by using the keyword search tool below to find specific information within the annual report.-
 1
1 -
 2
2 -
 3
3 -
 4
4 -
 5
5 -
 6
6 -
 7
7 -
 8
8 -
 9
9 -
 10
10 -
 11
11 -
 12
12 -
 13
13 -
 14
14 -
 15
15 -
 16
16 -
17
-
18
-
19
-
20
-
21
-
22
-
23
-
24
-
25
-
26
-
27
-
28
-
29
-
30
-
31
-
32
-
33
-
34
-
35
-
36
-
37
-
38
-
39
-
40
-
41
-
42
-
43
-
44
-
45
-
46
-
47
-
48
-
49
-
50
-
51
-
52
-
53
-
54
-
55
-
56
-
57
-
58
-
59
-
60
-
61
-
62
-
63
-
64
 |
 |

2005 WESTJET ANNUAL REPORT
3
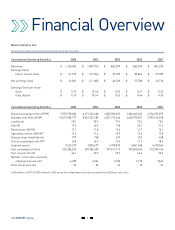
FINANCIAL
OVERVIEW
Operational Terms Explained
REVENUE PASSENGER MILES A measure of passenger
traffic, calculated as the number of revenue passengers
multiplied by the total distance flown.
AVAILABLE SEAT MILES A measure of total passenger
capacity, calculated by multiplying the total number of
seats available for sale by the total distance flown.
LOAD FACTOR A measure of total capacity utilization,
calculated as the proportion of total available seat miles
occupied by revenue passengers.
YIELD (revenue per revenue passenger mile) A measure of
unit revenue, calculated as the gross revenue generated
per revenue passenger mile.
Revenue (MILLIONS OF DOLLARS)
Available Seat Miles (MILLIONS)
Average Stage Length (MILES)
1,395
1,058
864
683
481
10,673
8,963
6,872
4,651
2,996
797
760
657
552
458