United Healthcare 2014 Annual Report Download - page 90
Download and view the complete annual report
Please find page 90 of the 2014 United Healthcare annual report below. You can navigate through the pages in the report by either clicking on the pages listed below, or by using the keyword search tool below to find specific information within the annual report.-
 1
1 -
2
-
3
-
4
-
5
-
6
-
7
-
8
-
9
-
10
-
11
-
12
-
13
-
14
-
15
-
16
-
17
-
18
-
19
-
20
-
21
-
22
-
23
-
24
-
25
-
26
-
27
-
28
-
29
-
30
-
31
-
32
-
33
-
34
-
35
-
36
-
37
-
38
-
39
-
40
-
41
-
42
-
43
-
44
-
45
-
46
-
47
-
48
-
49
-
50
-
51
-
52
-
53
-
54
-
55
-
56
-
57
-
58
-
59
-
60
-
61
-
62
-
63
-
64
-
65
-
66
-
67
-
68
-
69
-
70
-
71
-
72
-
73
-
74
-
75
-
76
-
77
-
78
-
79
-
 80
80 -
 81
81 -
 82
82 -
 83
83 -
 84
84 -
 85
85 -
 86
86 -
 87
87 -
 88
88 -
 89
89 -
 90
90 -
 91
91 -
 92
92 -
 93
93 -
 94
94 -
 95
95 -
 96
96 -
 97
97 -
 98
98 -
 99
99 -
 100
100 -
101
-
102
-
103
-
104
-
105
-
106
-
107
-
108
-
109
-
110
-
111
-
112
-
113
-
114
-
115
-
116
-
117
-
118
-
119
-
120
 |
 |

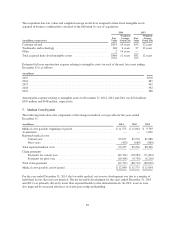
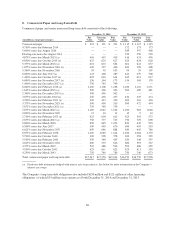
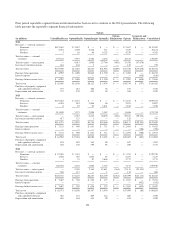
The following table provides a summary of the effect of changes in fair value of fair value hedges on the
Company’s Consolidated Statements of Operations:
For the Years Ended December 31,
(in millions) 2014 2013 2012
Hedge — interest rate swap gain (loss) recognized in interest expense ......... $170 $(166) $ 3
Hedged item — long-term debt (loss) gain recognized in interest expense ...... (170) 166 (3)
Net impact on the Company’s Consolidated Statements of Operations ......... $ — $ — $ —
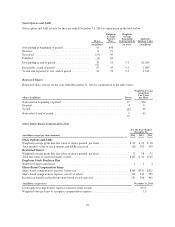
9. Income Taxes
The current income tax provision reflects the tax consequences of revenues and expenses currently taxable or
deductible on various income tax returns for the year reported. The deferred income tax provision or benefit
generally reflects the net change in deferred income tax assets and liabilities during the year, excluding any
deferred income tax assets and liabilities of acquired businesses. The components of the provision for income
taxes for the years ended December 31 are as follows:
(in millions) 2014 2013 2012
Current Provision:
Federal .......................................................... $3,883 $3,004 $2,638
State and local .................................................... 271 237 150
Total current provision .................................................. 4,154 3,241 2,788
Deferred provision ..................................................... (117) 1 308
Total provision for income taxes .......................................... $4,037 $3,242 $3,096
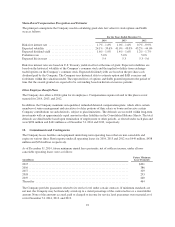
The reconciliation of the tax provision at the U.S. federal statutory rate to the provision for income taxes and the
effective tax rate for the years ended December 31 is as follows:
(in millions, except percentages) 2014 2013 2012
Tax provision at the U.S. federal statutory rate .......... $3,380 35.0% $3,120 35.0% $3,018 35.0%
Industry tax ...................................... 469 4.8 — — — —
State income taxes, net of federal benefit ............... 154 1.6 126 1.4 143 1.7
Tax-exempt investment income ...................... (49) (0.5) (53) (0.6) (59) (0.7)
Non-deductible compensation ........................ 96 1.0 39 0.5 22 0.2
Other, net ........................................ (13) (0.1) 10 0.1 (28) (0.3)
Provision for income taxes .......................... $4,037 41.8% $3,242 36.4% $3,096 35.9%
The higher tax rate for 2014 is mostly due to the nondeductibility of the Industry Tax. The higher effective
income tax rate for 2013 as compared to 2012 primarily resulted from the favorable resolution of various one-
time tax matters in 2012.
88