United Healthcare 2014 Annual Report Download - page 79
Download and view the complete annual report
Please find page 79 of the 2014 United Healthcare annual report below. You can navigate through the pages in the report by either clicking on the pages listed below, or by using the keyword search tool below to find specific information within the annual report.-
 1
1 -
2
-
3
-
4
-
5
-
6
-
7
-
8
-
9
-
10
-
11
-
12
-
13
-
14
-
15
-
16
-
17
-
18
-
19
-
20
-
21
-
22
-
23
-
24
-
25
-
26
-
27
-
28
-
29
-
30
-
31
-
32
-
33
-
34
-
35
-
36
-
37
-
38
-
39
-
40
-
41
-
42
-
43
-
44
-
45
-
46
-
47
-
48
-
49
-
50
-
51
-
52
-
53
-
54
-
55
-
56
-
57
-
58
-
59
-
60
-
61
-
62
-
63
-
64
-
65
-
66
-
67
-
68
-
 69
69 -
 70
70 -
 71
71 -
 72
72 -
 73
73 -
 74
74 -
 75
75 -
 76
76 -
 77
77 -
 78
78 -
 79
79 -
 80
80 -
 81
81 -
 82
82 -
 83
83 -
 84
84 -
 85
85 -
 86
86 -
 87
87 -
 88
88 -
 89
89 -
90
-
91
-
92
-
93
-
94
-
95
-
96
-
97
-
98
-
99
-
100
-
101
-
102
-
103
-
104
-
105
-
106
-
107
-
108
-
109
-
110
-
111
-
112
-
113
-
114
-
115
-
116
-
117
-
118
-
119
-
120
 |
 |
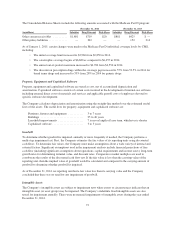
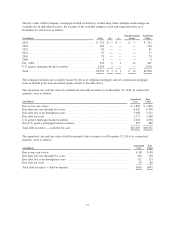
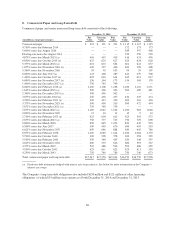
The fair values of the Company’s mortgage-backed securities by credit rating (when multiple credit ratings are
available for an individual security, the average of the available ratings is used) and origination date as of
December 31, 2014 were as follows:
(in millions) AAA AA A
Non-Investment
Grade
Total Fair
Value
2014 ............................................. $ 222 $ — $ — $ — $ 222
2013 ............................................. 164 — — — 164
2012 ............................................. 81 — — — 81
2011 ............................................. 17 — — — 17
2010 ............................................. 23 — — — 23
2009 ............................................. 6 — — — 6
Pre - 2009 ......................................... 354 1 1 11 367
U.S. agency mortgage-backed securities ................. 2,054 2 — — 2,056
Total ............................................. $2,921$3$1 $11 $2,936
The Company includes any securities backed by Alt-A or subprime mortgages and any commercial mortgage
loans in default in the non-investment grade column in the table above.
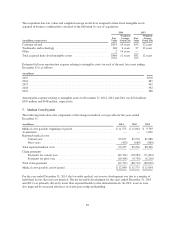
The amortized cost and fair value of available-for-sale debt securities as of December 31, 2014, by contractual
maturity, were as follows:
(in millions)
Amortized
Cost
Fair
Value
Due in one year or less ....................................................... $ 1,822 $ 1,826
Due after one year through five years ........................................... 6,632 6,709
Due after five years through ten years ........................................... 5,086 5,212
Due after ten years .......................................................... 1,771 1,868
U.S. agency mortgage-backed securities ......................................... 2,022 2,056
Non-U.S. agency mortgage-backed securities ..................................... 872 880
Total debt securities — available-for-sale ........................................ $18,205 $18,551
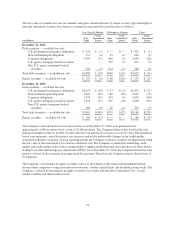
The amortized cost and fair value of held-to-maturity debt securities as of December 31, 2014, by contractual
maturity, were as follows:
(in millions)
Amortized
Cost
Fair
Value
Due in one year or less ......................................................... $ 88 $ 88
Due after one year through five years ............................................. 210 210
Due after five years through ten years ............................................. 112 113
Due after ten years ............................................................ 85 86
Total debt securities — held-to-maturity ........................................... $495 $497
77