United Healthcare 2014 Annual Report Download - page 35
Download and view the complete annual report
Please find page 35 of the 2014 United Healthcare annual report below. You can navigate through the pages in the report by either clicking on the pages listed below, or by using the keyword search tool below to find specific information within the annual report.-
 1
1 -
2
-
3
-
4
-
5
-
6
-
7
-
8
-
9
-
10
-
11
-
12
-
13
-
14
-
15
-
16
-
17
-
18
-
19
-
20
-
21
-
22
-
23
-
24
-
 25
25 -
 26
26 -
 27
27 -
 28
28 -
 29
29 -
 30
30 -
 31
31 -
 32
32 -
 33
33 -
 34
34 -
 35
35 -
 36
36 -
 37
37 -
 38
38 -
 39
39 -
 40
40 -
 41
41 -
 42
42 -
 43
43 -
 44
44 -
 45
45 -
46
-
47
-
48
-
49
-
50
-
51
-
52
-
53
-
54
-
55
-
56
-
57
-
58
-
59
-
60
-
61
-
62
-
63
-
64
-
65
-
66
-
67
-
68
-
69
-
70
-
71
-
72
-
73
-
74
-
75
-
76
-
77
-
78
-
79
-
80
-
81
-
82
-
83
-
84
-
85
-
86
-
87
-
88
-
89
-
90
-
91
-
92
-
93
-
94
-
95
-
96
-
97
-
98
-
99
-
100
-
101
-
102
-
103
-
104
-
105
-
106
-
107
-
108
-
109
-
110
-
111
-
112
-
113
-
114
-
115
-
116
-
117
-
118
-
119
-
120
 |
 |
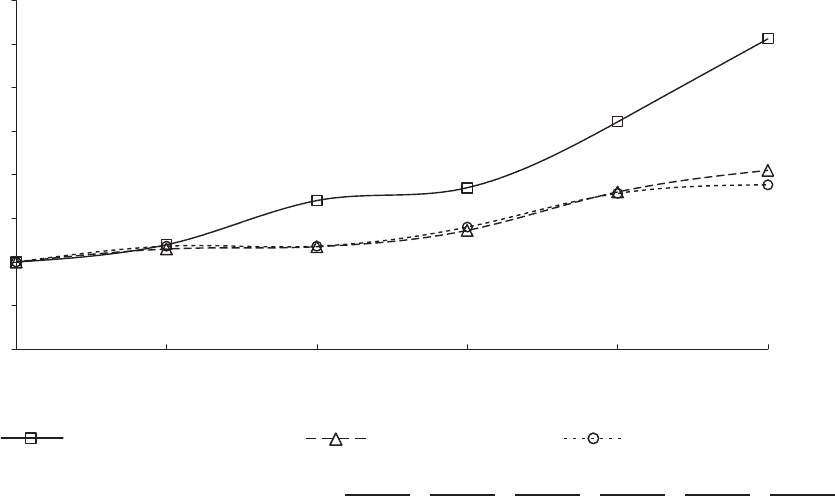
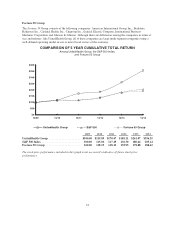
Fortune 50 Group
The Fortune 50 Group consists of the following companies: American International Group, Inc., Berkshire
Hathaway Inc., Cardinal Health, Inc., Citigroup Inc., General Electric Company, International Business
Machines Corporation and Johnson & Johnson. Although there are differences among the companies in terms of
size and industry, like UnitedHealth Group, all of these companies are large multi-segment companies using a
well-defined operating model in one or more broad sectors of the economy.
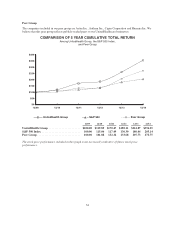
COMPARISON OF 5 YEAR CUMULATIVE TOTAL RETURN
Among UnitedHealth Group, the S&P 500 Index,
and Fortune 50 Group
UnitedHealth Group S&P 500 Fortune 50 Group
$0
$200
$150
$100
$50
$250
$300
$400
$350
12/09 12/10 12/11 12/12 12/13 12/14
12/09 12/10 12/11 12/12 12/13 12/14
UnitedHealth Group ...................... $100.00 $119.89 $170.47 $185.11 $261.07 $356.25
S&P 500 Index ........................... 100.00 115.06 117.49 136.30 180.44 205.14
Fortune 50 Group ........................ 100.00 118.15 118.12 139.95 178.88 188.42
The stock price performance included in this graph is not necessarily indicative of future stock price
performance.
33